User story mapping has become a go-to technique in Scrum for effectively capturing and visualizing user requirements. While Product Managers and Agile teams commonly leverage this approach, user story mapping extends its benefits to various stakeholders involved in the Scrum process. This article will act as a comprehensive guide for Agile Product Development. Indeed, it will explore how the different users in Scrum can harness its power to drive successful product development.
Product Managers
As the orchestrators of product vision and strategy, product managers play a vital role in user story mapping. Not only do they utilize this technique to gain a holistic view of user needs, but also prioritize features. User story mapping helps product managers identify gaps, dependencies, and opportunities, enabling them to make informed decisions that align with the overall product vision.
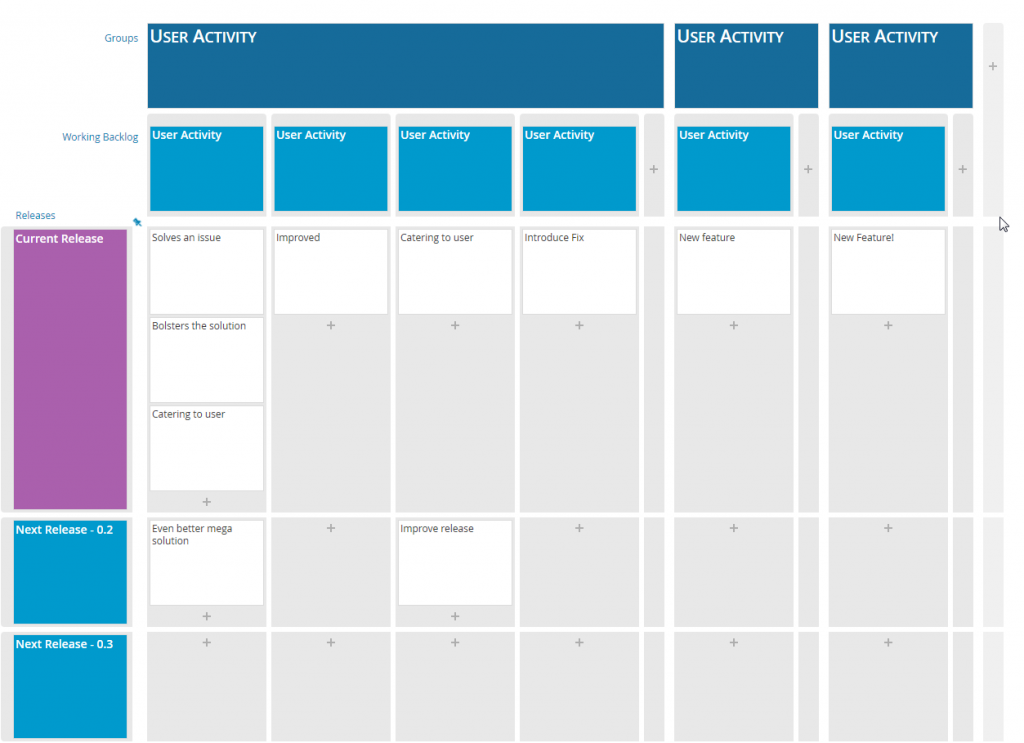
A holistic view of the roadmap provides insightful information on the overall progress of the project
Scrum Masters
Scrum Masters act as facilitators and coaches for the Scrum team. They play a crucial role in ensuring effective collaboration and communication. Hence, user story mapping serves as a valuable tool to guide and facilitate user story discussions and sprint planning. It helps them create a shared understanding among team members and fosters a collaborative environment.
Development Teams
As for development teams, they are at the heart of the Scrum process, responsible for transforming user stories into working product increments. As a matter of fact, user story mapping helps development teams gain clarity on user requirements, dependencies, and priorities. It enables them to plan their work effectively, break down stories into actionable tasks, and align their efforts toward delivering value to end-users.
Designers
Next, user story mapping allows Designers to understand the user journey and design experiences that meet user needs. By visualizing user stories, designers can identify touchpoints, pain points, and opportunities to enhance the user experience. They can collaborate with product managers and development teams to create intuitive and user-centric designs.
Stakeholders
Finally, stakeholders such as executives, customers, and business analysts, benefit from user story mapping by gaining visibility into the product development process. The tool provides a clear picture of the product’s direction, timeline, and expected features. All stakeholders can actively participate in discussions, provide feedback, and ensure alignment with business objectives.
Easily leave comments or discuss with all stakeholders on the selected card
All in all, user story mapping is a versatile technique that caters to various users involved in Scrum. From product managers shaping the product vision to development teams delivering working increments, each stakeholder benefits from the shared understanding and collaborative environment fostered by user story mapping. By leveraging this technique, Scrum teams can streamline their processes, enhance communication, and deliver products that truly meet user needs.
Start embracing the power of user story mapping and unlock the full potential of Scrum!
You would like to implement user story mapping in your team but don’t know where to start? Check out our games to Teach & Learn user story mapping! Use our premade templates as a basis or read through our step-by-step guide to create your own from scratch!
Agile project management has become an integral part of software development methodologies. It has revolutionized the way software development teams operate, making them more flexible and adaptable to changing market demands. At FeatureMap, a User Story Mapping Software company built by engineers, we believe that User Story Mapping is the best agile technique for managing software development projects.
What is User Story Mapping?
User Story Mapping is a technique used in agile project management to plan and organize product development based on user needs. It involves creating a visual representation of user stories, which are short, simple descriptions of a feature or functionality that a user needs to accomplish a specific task. The user stories are then grouped into themes or epics, and arranged in a hierarchical order to create a map of the product development process.
Why is User Story Mapping the Best Agile Technique?
User Story Mapping is the best agile technique for several reasons. Firstly, it helps in prioritizing techniques by providing a clear understanding of the user needs and requirements. This enables the development team to focus on the most important features and functionalities, ensuring that the product meets the user’s needs and expectations.
Secondly, User Story Mapping is a lightweight and non-nonsense stand-alone solution, which means that it is easy to use and does not require any additional software or tools. This makes it accessible to all members of the development team, regardless of their technical expertise.
Thirdly, User Story Mapping is an effective tool for creating agile project plans. By providing a clear and concise overview of the user stories and their priorities, it enables the development team to plan and schedule their work more efficiently. This ensures that the project stays on track and is completed within the required timeframe.
Example of User Story Mapping in Agile Project Management
Let us consider an example of how User Story Mapping can be used in agile project management. Suppose we are developing a project management software using agile development software. The first step is to identify the user needs and requirements. This can be done by creating user stories, such as “As a project manager, I want to be able to assign tasks to team members, so that I can track their progress and ensure timely completion of the project.”
Once the user stories have been created, they can be organized into themes or epics, such as “Project Management,” “Task Assignment,” and “Progress Tracking.” These themes can then be arranged in a hierarchical order, creating a map of the product development process.
Using User Story Mapping, the development team can easily prioritize the user stories based on their importance and create an agile project plan that focuses on the most critical features and functionalities. This ensures that the project is completed within the required timeframe and meets the user’s needs and expectations.
The Bottom Line
User Story Mapping is one of the best agile techniques for managing software development projects. It helps in prioritizing techniques, creating agile project plans, and providing a lightweight and non-nonsense stand-alone solution. At FeatureMap, we believe that User Story Mapping is essential for any software development team that wants to be agile and flexible in today’s fast-paced market.
You can try FeatureMap and get started with making your first map right away, and for free.
As a project leader, you know that Agile methodology is essential for successful software development. User story mapping is a prioritizing technique that helps teams understand the user’s needs and plan the development process. At FeatureMap.co, we offer an agile tool that simplifies user story mapping and streamlines the software development process. In this post, we’ll discuss the advantages of Agile methodology and explain how our tool can help you achieve your project goals.
What is Agile Methodology?
Agile methodology is a software development methodology that emphasizes flexibility, collaboration, and continuous improvement. Unlike traditional Waterfall methodology, which involves a linear approach to software development, Agile methodology involves iterative development and testing.
Agile methodology offers numerous advantages, including faster time-to-market, improved quality, increased customer satisfaction, and reduced risk. By using Agile methodology, teams can respond quickly to changing requirements and deliver software that meets the user’s needs.
User Story Mapping
User story mapping is a prioritizing technique that helps teams understand the user’s needs and plan the development process. It involves breaking down the user’s requirements into small, manageable stories that can be completed in an Agile sprint. User story mapping ensures that the development team is focused on delivering features that are valuable to the user.
For example, imagine that you are developing a project management tool. Your user stories might include creating tasks, assigning tasks to team members, and tracking progress. By breaking down the user’s requirements into small stories, you can prioritize the features that will provide the most value to the user.
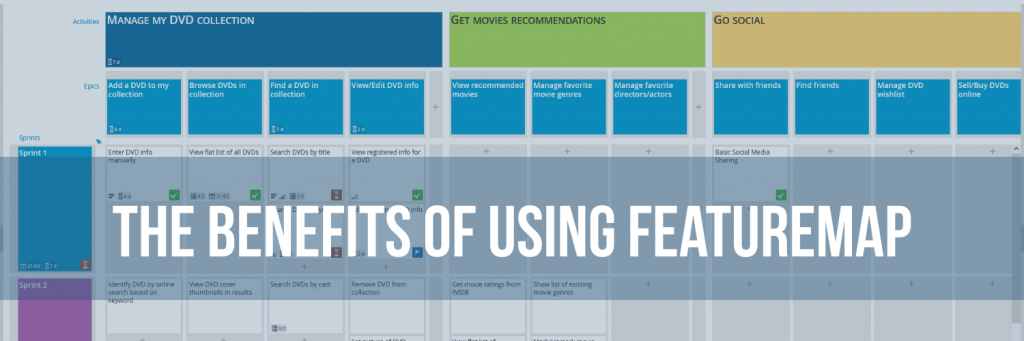
The Benefits of Using FeatureMap
At FeatureMap, we offer an Agile development software that simplifies user story mapping and streamlines the software development process. Our tool offers a collaborative environment that allows teams to work together seamlessly, ensuring that everyone is on the same page.
Our tool is easy to use, even for teams that are new to Agile methodology. With real-time tracking and prioritizing features, our tool ensures that everyone is working towards the same project goals.
How FeatureMap’s Tool Can Help with Agile Project Plans
Our tool offers numerous benefits to Agile project planning, including:
Prioritizing features: Our tool makes it easy to prioritize features based on user needs, ensuring that the development team is focused on delivering features that provide the most value.
Creating a shared understanding: FeatureMap helps teams all get on the same page by seeing the visual big picture.
Story points in Jira: Our tool integrates with Jira, allowing teams to track their progress and estimate the time required to complete each task.
Real-time tracking: Our tool offers real-time tracking of progress, allowing teams to identify and address issues quickly.
So what next?
Agile methodology is essential for successful software development, and user story mapping is a key prioritizing technique that helps teams deliver software that meets the user’s needs. FeatureMap’s Agile development software offers numerous benefits, including a streamlined development process, a collaborative environment, and real-time tracking. If you’re looking to improve your Agile project plans, we encourage you to try it out free today.
What are the main differences between a user story and a user journey?
A user story is a brief, concise description of a task from the perspective of the user.
For example: “As a ‘type of user‘, I want ‘some goal’ so that ‘some reason’.”
A user journey is a described series of steps that show how a typical user would interact with the web app that is being designed.
The main difference between the two, is that a user story is based on a specific user and caters to a particular type of user to answer a specific problem. A user journey can follow a “random user” that may using the tool. This also includes dynamic user journey scenarios.
How can User Story Mapping help integrate both a user story and a user journey?
User Story Mapping has been described as a tool that can be used for many purposes, including product development, feature definition, version improvement, and project management.
In short, you are able to create a map, highlighting the user story, as a persona, whilst building the map for a user journey. Placing cards and tasks and building out the entire epic.
You can get started straight away, and intuitively you’ll be building maps that remove the debate between user story and user journey. Just head over to FeatureMap.co to get started.
Otherwise, read on to get the steps to get started.
We are looking at the steps to create answers that fulfil both requirements for a user story, whilst also catering to the user journey.
Here, we explore how best to utilise the User Story Mapping methodology to help define your path. We also have the added bonus that the first two steps instantly reward in their own right.
The first two steps can be very rewarding. Firstly, planning the map will give you a pathway to the point where you can start writing user stories or journeys.
Secondly, the end result is a visual chart showing the structure of your stories. This will give you the steps you need to take for development.
Here is another way to approach User Story Mapping in three steps.
This is a relatively quick way of getting to a point where you can start development work.
The start of a user story map on FeatureMap
Hosting your Story Mapping Session
Because User Story Mapping can be complex, it is important to have a framework for the session. It is also important to explain what User Story Mapping is and describe the process.
Start with tasks where the team thinks about the product, users, development, and personas.
Step One
We start by brainstorming every task that users will want to address when using the product.
Silent Brainstorming.
Task each participant to write down steps in your cards, every step will need to cover from the users first engagement to the conclusion of the users interaction. Encourage the team to think of these as actions not features.
It’s okay for each individual on the team to focus on other user journeys. For example if we take an app, someone may do a customer, and another may write about a copywriter, whilst the developers may think from the perspective of the administrators.
Top Tip: Writing them so they start with a verb is a good technique.
Encourage people to be creative and try to cover tasks and steps wide, but not deep. This part of User Story Mapping is about breadth not depth.
Start posting all cards and tasks in one large map.
That’s fine if you have duplicates. Just group them together, and these should sit beside each other on the line (not above or below).
As you expand and get into the swing of it you can easily drag and drop and delete if needed.
The beauty of using digital software for large collaboration tasks such as this allows you and you and your team to easily edit, expand and develop your map all at the same time.
This first line is the user tasks, and they form the backbone of your story map.
Step Two
Then we organise these tasks into wider goals, and arrange them in order of completion.
These groups are known as “epics” or “activities”.
As facilitator, you can walk along the line of tasks and ask where the team think the splits are between each group of tasks, and what each group should be called.
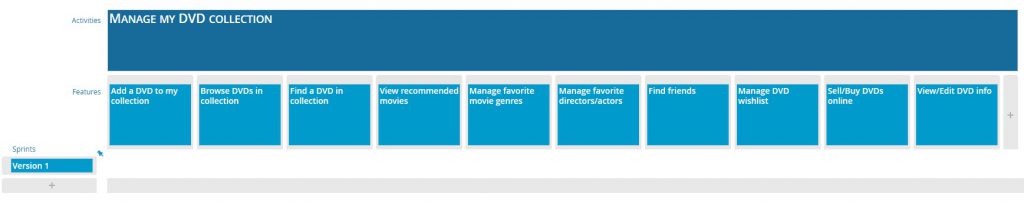
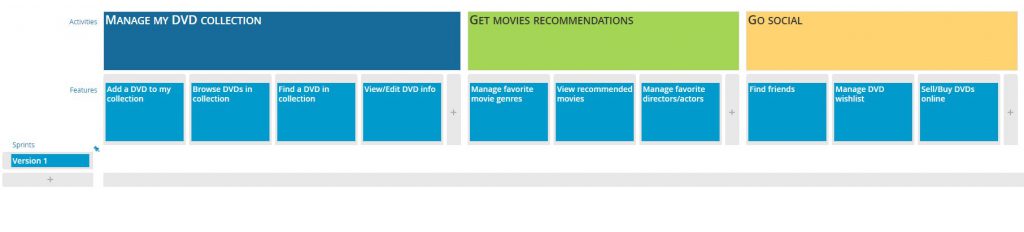
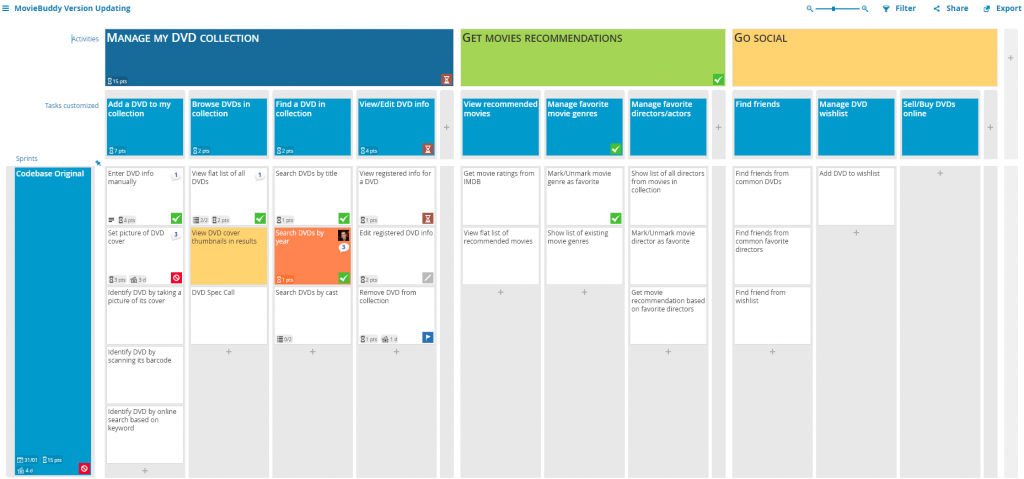
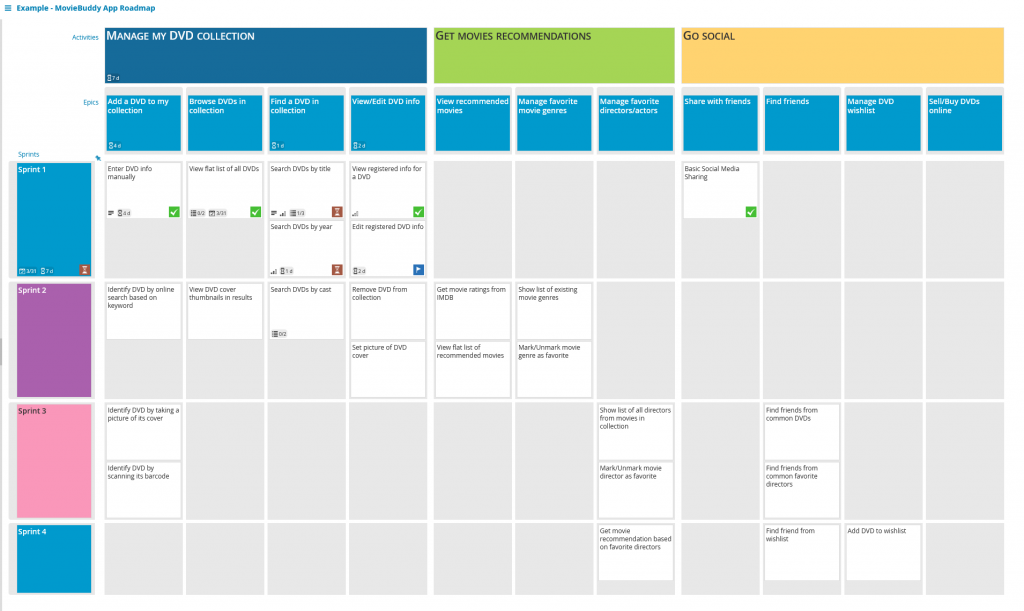
For example, if you were building an app for an app to arrange your movies, you might group user tasks into epics like this:
Browse DVDs in collection – epic
View flat list of all DVDs – user task
View DVD cover thumbnails in results – user task
DVD Spec Call – user task
Step Three
We can then move into the Prioritisation exercise, further developing the user story map.
This is the stage where you start writing in the details, building up the tasks and redefining tasks.
This may include adding tasks, merging tasks or separating tasks.
It is important to detail the tasks enough to remember in the future. After writing all the tasks, you should have a comprehensive map by this stage. Task your team to go over each line (now defined as Epics/activities) and ensure you have everything charted. This is where the User Story Map will become easier, as you will now have a visual chart of a defined product. Here you can move to the next steps.
Next Steps
Now you are ready to start prioritising the user stories on your map. You can start adapting and moving your tasks to sprints, also known as versions for your product.
You could do an entire User Story session with Post-It notes with your in-house team, but better yet digitally, remotely or supporting your in person meeting using FeatureMap.co.
A User Story map is a perfect tool to visualise product roadmaps for non-technical stakeholders. Feature Map allows you to create your entire product and give an incredibly rich overview.
This allows you to visualise the whole user journey and how it maps its features into the product.
A completed user story map is the perfect centrepiece of any product discussion with stakeholders.
How it works is simple.
First, identify your personas.
They capture your goals, your behaviours and the needs for the end user.
They help you build your story map and give it life.
The personas should always be kept in mind when you add features to your board. Personas can naturally be real people or groups and made up.
The next step is simple.
Understand the user journey.
Take those personas and map out your product with each feature identified as a goal.
Break down each goal into a set of consecutive activities. It can help if you line up these personas to each of these goals.
Then capture each requirement to help achieve that user goal with the help of the stakeholders.
You should be able to formulate all the user stories and the acceptance criteria of what you want to build. Add as many details as you wish to each feature for your team to fully understand the goal.
Control your map, add details, add status, aggregate and take control of your backlog.
You can add with future map annotations and estimate your features, time, budget or any other custom status.
Your team can collaborate on each feature by adding comments and tagging one another.
You can also add a set of different colours to help organise your map.
Once you have completed mapping your user stories journey, you will then be able to prioritise your backlog.
Each feature needs to be mapped to release, and the Golden Rule is that each release needs to be a valuable product slice across the user journey.
Finally, do your last steps.
The most important features are placed at the top.
You’ll wish to start out simple and expand on the functionality of your product by adding new product slices.
These product slices can be converted into MVP’s or Sprint’s. With Feature Map, your product can evolve constantly and cards can be moved around by simply dragging and dropping.
You can also aggregate the values of each task on your map and be able to see how long in time or how much in budget each slice and goal may cost.
You can finally eradicate your long list of features, your overwhelming sprint lists, and your misleading Gantt charts.
A story map is the perfect tool to communicate your product vision with the members of your team and non-technical stakeholders. It beautifully pulls together the big picture and allows you to prioritise your product and progress while not forgetting the details.
Once you are happy, you can share your feature map board to anyone. Or you can invite your own team to collaborate further. Additionally, you can integrate with JIRA.
Creating a product map can feel intimidating, but with the right tools, it can be completed in no time. A systematic planning process and the right tool can get your project plan mapped out and finished in less than an hour.
A product map answers three basic questions:
What activities do you need to do?
Who will do these activities?
How long will these activities take?
It’s super easy, and it’s even better when you bring a team along with you to get started.
So how to start?
Step 1: Define your product
A story user map can be used as a method for visually outlining your roadmap for your product.
You will need to think of your product in stages, from high level to detailed level. Break your product down to varied groupings, then into steps, and then into further detail. Turn these steps into cards.
Product owner, testers, technical lead, customer support, architect, developers, UX/UI designer, sales and marketing, etc. All have their own techniques and requirements which will help you create your map.
With the questions above, what, who, why.
Step 2: Build that Map out.
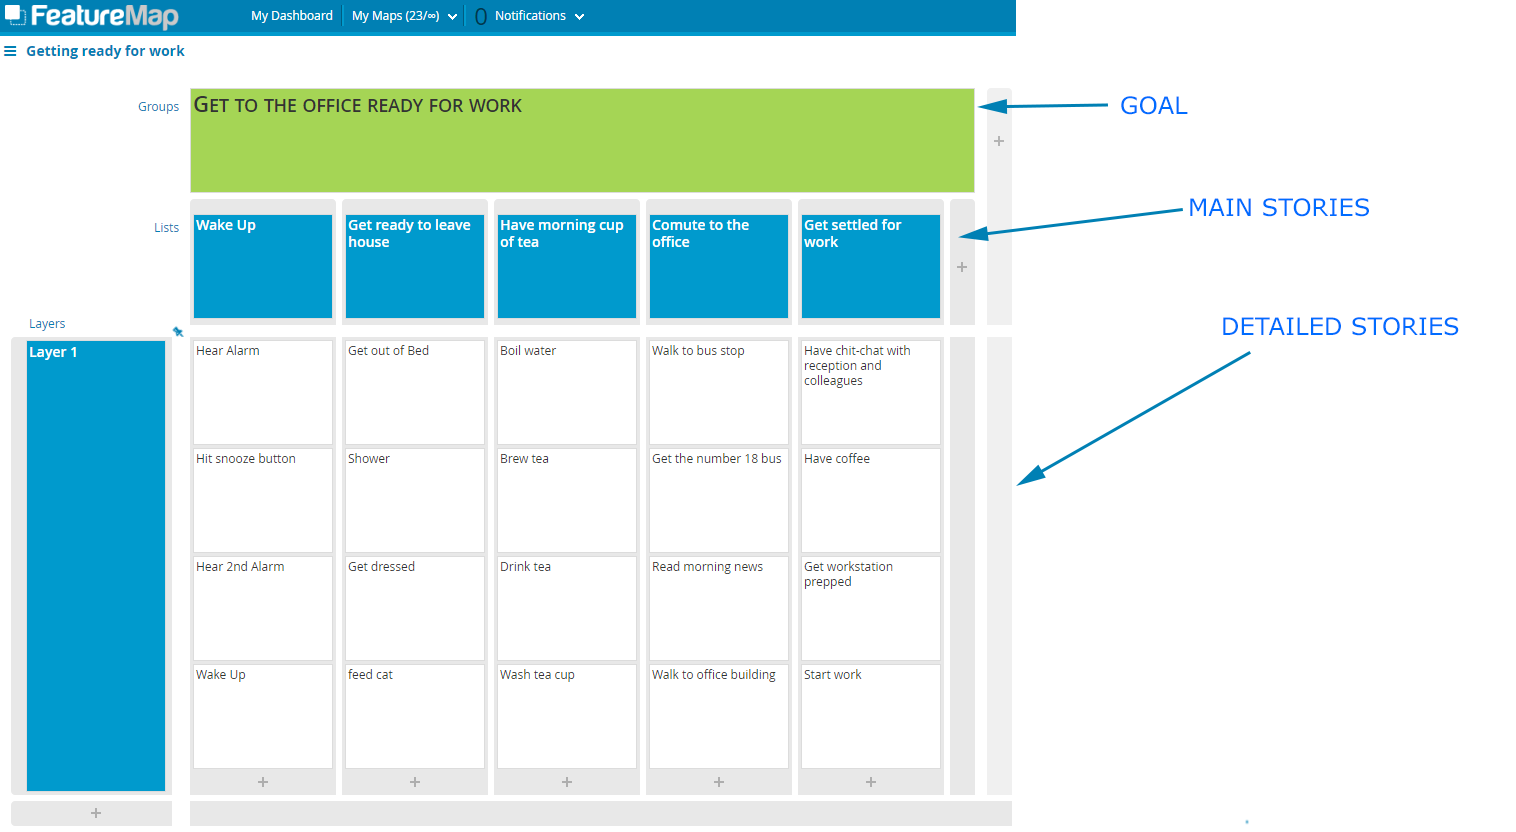
If you are brand new to user story mapping, we have a short and sweet exercise. Let’s take a simple real-life example of “getting ready for work”.
The Story Map of Alex’s Morning
Start with the goal. What is the story map about? What are you trying to accomplish? The main overall purpose.
Second, list your main stories, your main tasks or activities. From left to right, insert the main steps of the story map that need to happen.
Move on and detail each main list – column by column, left to right.
In the case of product features, the layers can be then developed and then bingo bango. Done.
In a simple step you have your Product Map of high level tasks.
Product Map complete.
And it’s only step 2… granted the product map would have been done as soon as you applied your main stories and really its more like step 3 if we need drag out tasks, but really… User Story Mapping as a tool for Product Maps offers a value you can only understand once it is underway.
Step 3: Now you have your Product Map – Let it breath!
Story User Maps are ideal for allowing a team to design out a product feature and reduce the need to go back halfway through development because XYZ requirement. Let the project develop, evolve and change into larger, bigger projects or features.
You can develop and maintain any feature creep by creating new cards and assigning them into new sections.
You can add new requirements and manage the product map by assigning times, values, budgets and aggregating those values to the higher level cards.
The product map can become the defacto aid and tool in all your roles as Producer or CTO!
When building your story map approach it from all roles, if alone think about each responsibility in an order and feel free to create duplicates to then merge later. It’s about going with the flow and giving creative freedom to fleshing out a detailed product map. You can always edit, merge, delete in a later step. Due to their different foundations and interests, all roles have valuable points of view. As well as when working collaboratively with a team, everybody has an unmistakable and common comprehension of what they are about to build together.
As an aside, for further reading, we covered a series intro to story mapping with a basic run down and a simple exercise taking you through the morning tasks and making a map that may help, also don’t forget to check out some good practises in going from Idea to MVP.
Examples
We have a two examples below.
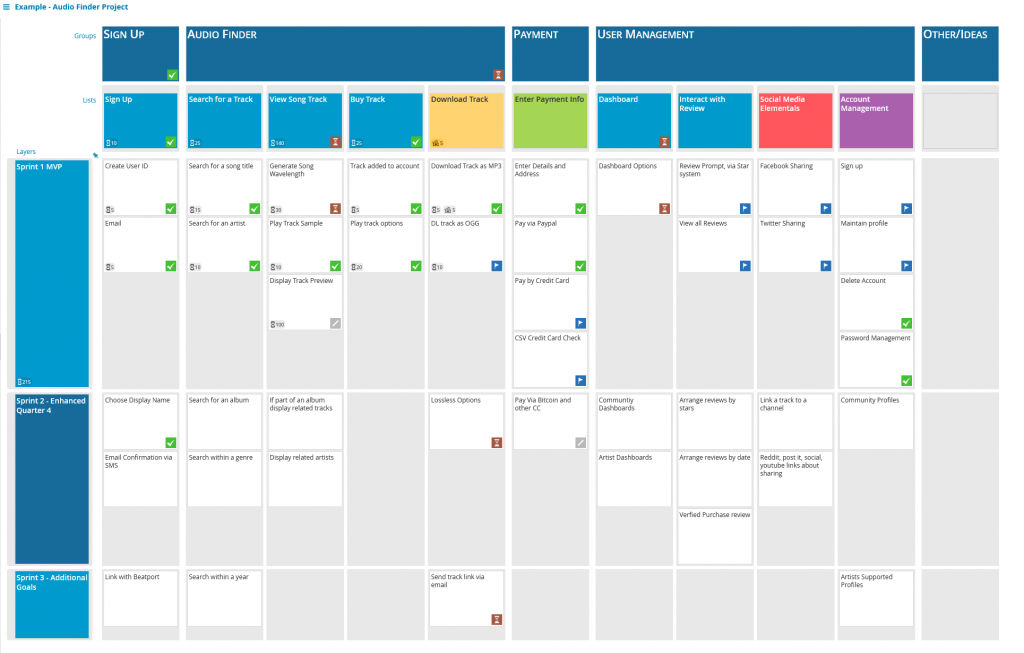
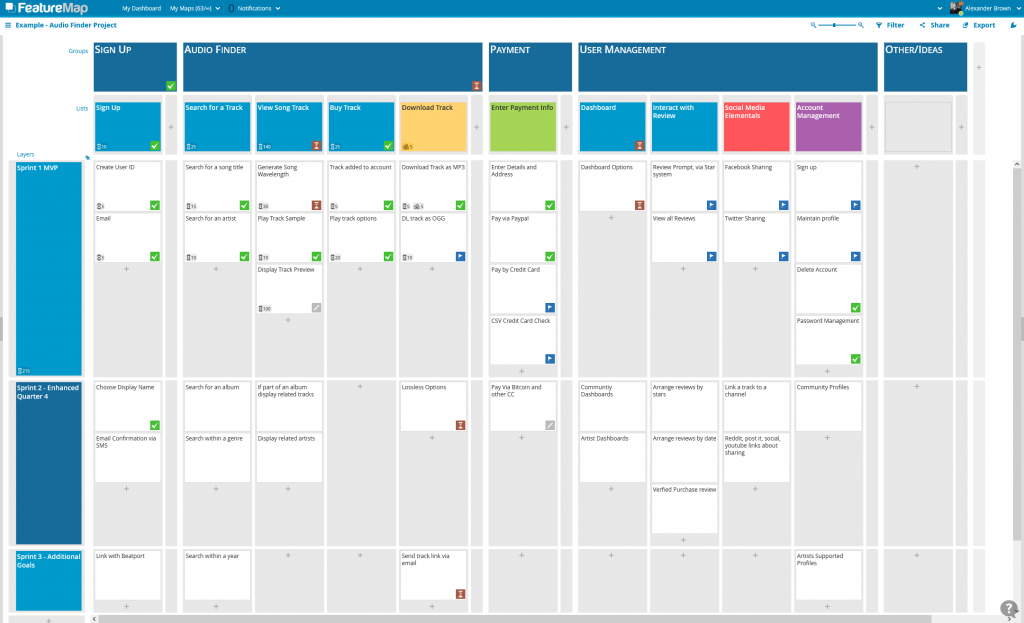
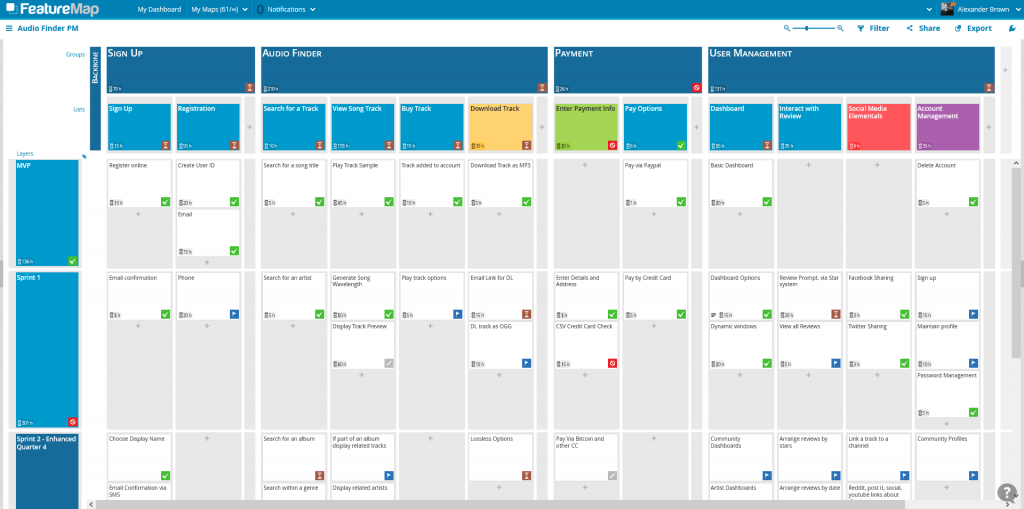
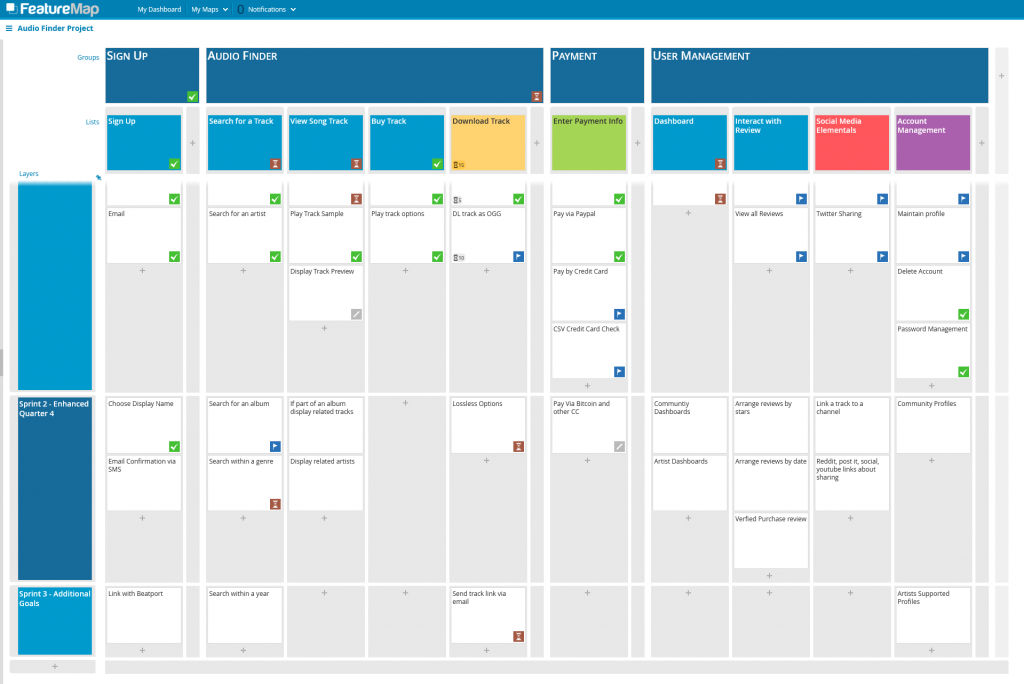
One is the Audio Finder Project, a board finished, with MVP defined, sprints defined and using some aggregation on the cards. A good example to see a finished map.
Audio Finder, a product map example with a finished MVP and aggregation.
One is the App for Lending Electronics, a board and map which is in the stage of “undergoing fine-tuning” and shows an example of half the map with tags and status applied, while the other half is still in flux. A good example to see a map undergoing evolution.
Lending Electronics, a product map example in progress.
If you want to give making your product map a go, quickly, check out FeatureMap and start for free.
User story mapping can allow your team to see and understand the product from a user-centric design. You can see the bigger picture of the product, help the team identify gaps and dependencies, and give the first framework of a shared understanding between your entire team.
A finished FeatureMap Board should have your entire product outlined. The team will have sections separated, and you’ll be scheduling and planning the outline of prioritized stories into sprints and releases.
In this article, we will share how to gain a better shared understanding of a map by utilising the feature of aggregation.
In short, it is the option of aggregating values. On each card you can assign a status, estimation and a budget. When you assign the aggregation option to a header card, the card will gather the values of all sub cards and calculate, dynamically, the overall status or number.
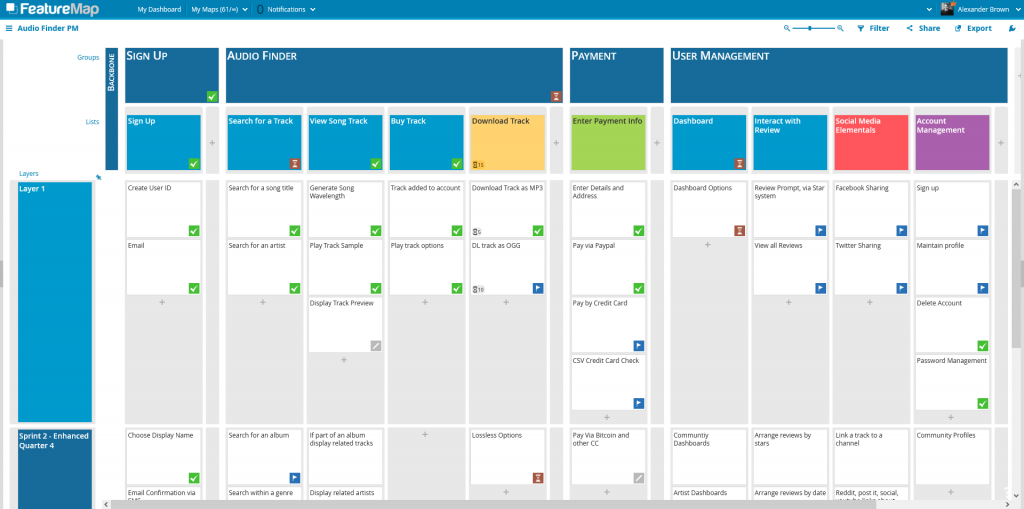
Here you can see the FeatureMap Board of the Audio Finder Product, fully incorporated with aggregation of both status and time.
A beautiful map, full of information, which can be daunting, but with ease you can see if the product development has any issues just by looking at the aggregated dynamic values on each of the layer headers.
Let’s break it down.
Status Aggregation
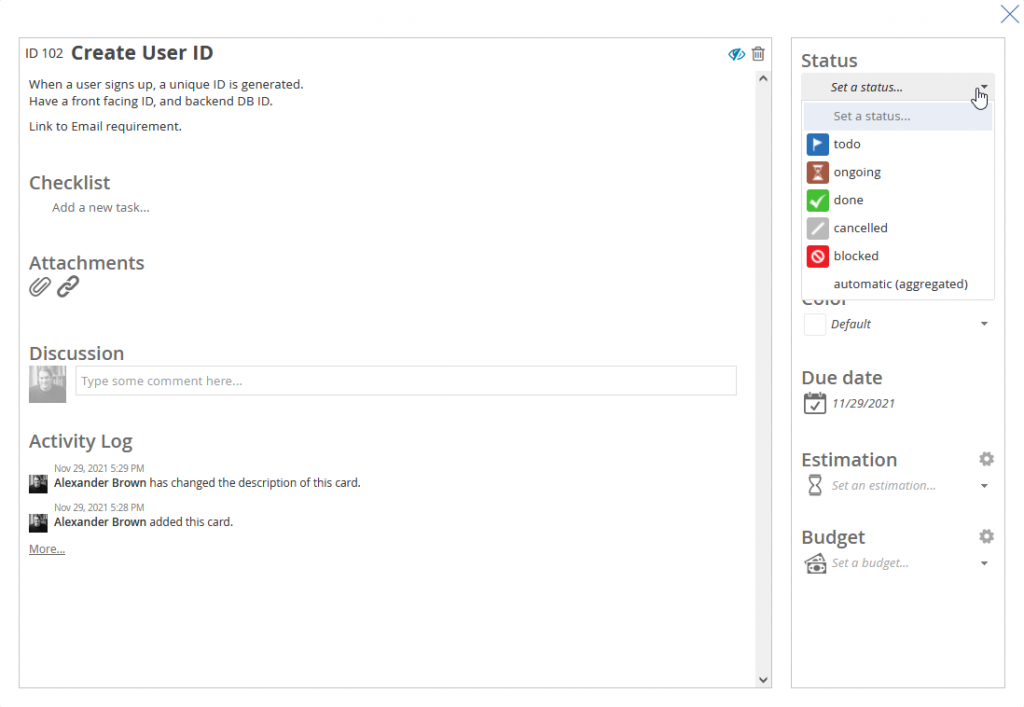
With Status, you are able to assign to a card, displaying a coloured icon on the main map. Great for that easy acquisition when viewing the larger map.
The statuses you can apply are: Todo, Ongoing, Done, Cancelled, Blocked.
The Card – Register Online: Applying a status for the state of its task.
With aggregation, you can apply the option “automatic (aggregated)” on your header cards, and the header card will a value by priority to display allowing the team to see each header, and associated higher task status.
A quick glance at a busy map can be even quicker with good application of status icons, and aggregation allowing you to identify issues and solve them quickly. This is one huge advantage for those busy product owners or leads ?
The priority for aggregation display is by importance: Blocked -> Ongoing -> Done.
When a card is set to “To-Do” and “Ongoing” are is aggregated as “Ongoing”.
When a column or layer has a “Blocked” card, this takes priority and is aggregated as “Blocked” as to draw attention to issues.
When all cards within a column/layer are done, the aggregated value draws “Done”.
The status “Cancelled” is ignored.
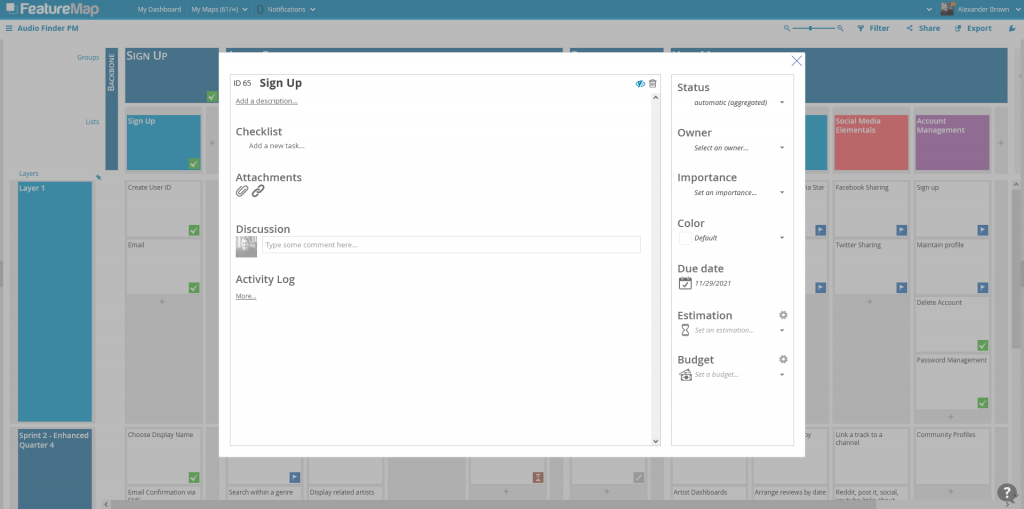
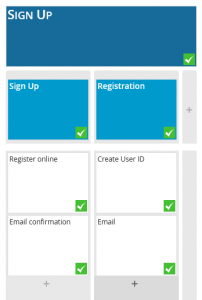
Automatic (aggregated) has been applied to this Sign Up Card (Header).
The header card (groups) Sign Up has been set to an automatic (aggregated) value.
The sub headers (lists), Sign Up and Registration are also set to automatic (aggregated).
The cards in those columns have all be seen set with “Done” status.
The value will dynamically be displayed based on the values of the cards within the sub-cards.
In this case, FeatureMap draws the values from Register Onlineand Email Confirmation.
Both are “Done”, so the value aggregated is “Done.”
Budget and Estimation Aggregation
The task status is not the only aggregation option. You can also track your assigned values of budget and estimation.
When you assign numbers to a card, and then aggregation to the header. It will draw vertically to each header group and list or, if applied to a layer header, it will draw horizontally to each layer. This allows you to see the overall bigger picture, but also a specific collection of times, costs or the main status of the project.
In this FeatureMap we are utilising Aggregation.
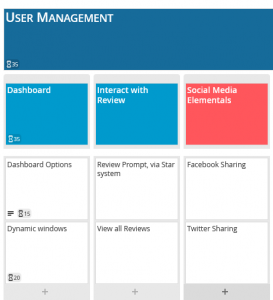
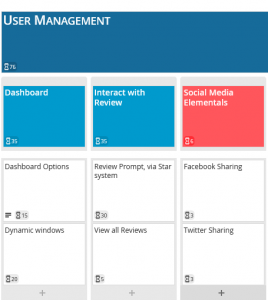
On the User Management Section, we are not aggregating status instead we are estimating the time it will take for our developers to code the described section.
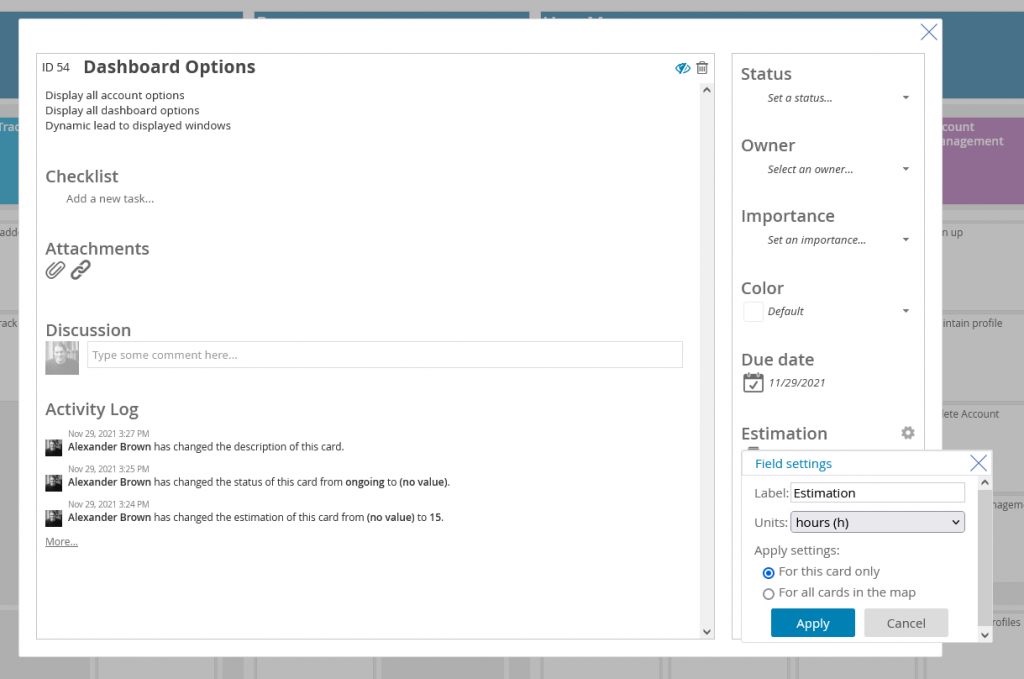
You can see the Dashboard Options Card is estimated to take 15 hours, and the Dynamic Windows Card is estimated to take 20 hours.
The header above – Dashboard draws those numbers and calculates both, giving us 35 hours. At a quick glance, the team now know the Dashboard feature should be done after 35 hours.
This aggregates higher to the USER MANAGEMENT header as well, showing us the value of 76 as it draws all estimations in it’s sub lists of Dashboard, Interact with Review and Social Media Elementals.
Customising the Aggregation Options.
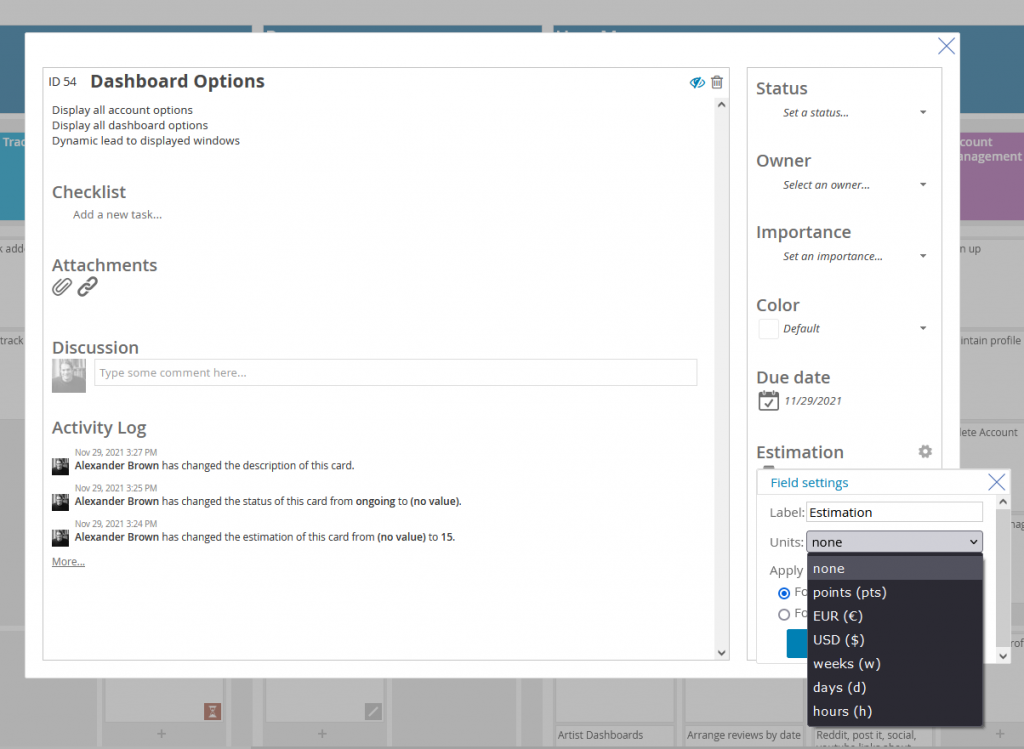
On both Estimation and Budget, you can rename the labels of these fields and assign units.
If you decide to do this after the fact, worry not, you can assign the field settings to a single card, or all cards on the map when editing the options.
The list of options available when customising your fields.
To edit, open up a card and click the grey cog wheel next to the Estimation or Budget field.
Here you can rename the fields, and assign units.
Units available are:
none (default)
points (pts)
EUR (€)
USD ($)
weeks (w)
days (d)
hours (h)
I settled on Estimation and used the units as “hours”.
Apply to all cards please, and let my map be beautifully informative.
Vertical or Horizontal
Aggregation can be applied horizontally or vertically.
When you apply it to the Group and List Headers (Vertically) the aggregation will be drawn from the entire column, spanning every sprint or value.
As such, it is much more common to see the aggregation applied horizontally to see the Sprint status.
Aggregate up or across. Dynamically see your sprints and tasks.
Aggregation Helps
A user story map need not be static. Teams can update it with findings from research spikes, revised estimations, and user feedback from sprints and releases. The story map can also be used as a visual roadmap to communicate both the planned work and the work that remains.
So if you find yourself as a product owner or project manager wondering the status of your developers, and you want to avoid it interrupting them distracting them or holding unnecessary meetings, the aggregation tool is invaluable for your management.
It allows your developers to keep you updated while allowing an optimal level of communication. Maybe they’ll get more done? ?
Give aggregation a go, you’ll be surprised how much control it gives to your map. You can access aggregation options with a Premium Subscription, or with the free sign-up trial.
Last week we released the new version of FeatureMap.
We’ve said our goodbyes to FeatureMap 3.4 – which had been valiantly running for over two years with just a few minor updates – and welcomed FeatureMap 4.0.
I’d like to give you some news about what our team has been working on over the past year and our plans for the future of FeatureMap. This update will probably sound unusually technical – I thought for once it would be nice to give you a deeper overview of what we have been doing behind the scenes.
While the changes might not be immediately apparent, as it is still the same FeatureMap you are familiar with, almost all parts of the application have been upgraded under the hood. Our goal with this release was to lay out the necessary foundation to support our plans for the next major features and design of FeatureMap.
One of the main benefits of this background work is that FeatureMap is now faster than ever: we’ve measured load times and request times reduced by over 40%. It is also a lot more stable and more resilient when something goes wrong in the network.
We’ve been constantly working away at improving FeatureMap and throughout the pandemic, we’ve seen the growth of working from home and a wider adoption of user story mapping as one of the best tools for collaborative product management. This has kept us motivated to bring the best out of FeatureMap and strengthened our resolve to make it better.
So, what has changed in FeatureMap 4.0?
Faster everything
FeatureMap boots faster, loads pages more quickly, and can save your changes instantly. Not only does it offer a more responsive user experience, it also improves the overall stability of the application. Plus, it means we can now deploy hotfixes whenever necessary without noticeable downtime.
New application domain name
We have decided to separate FeatureMap’s public website, which presents the application features, pricing and legal terms, from the application in which you can access your maps. Your maps now live under the domain name https://app.featuremap.co, which means the URLs of your maps and cards have changed.
But don’t worry: we’ve made sure all the old links keep working and simply redirect you to the new locations.
Calls to our API will still work with www.featuremap.co as the base domain name for several months. API users are encouraged to use the new app subdomain from now.
Usernames are gone + improved mentions in comments
Another decision we made was to remove all visible usernames from the application. We still use them internally, but we no longer want them to be the default way of referring to a FeatureMap user. Which means it won’t be possible to sign in to FeatureMap using a username anymore: we’ll ask for your email address instead.
This also means we had an opportunity to improve the way users could @mention people in card comments and make it a lot nicer and easier to use. Give it a try: just type @ in a comment, add a few letters to filter users by name or email, and choose the person you’d like to refer to.
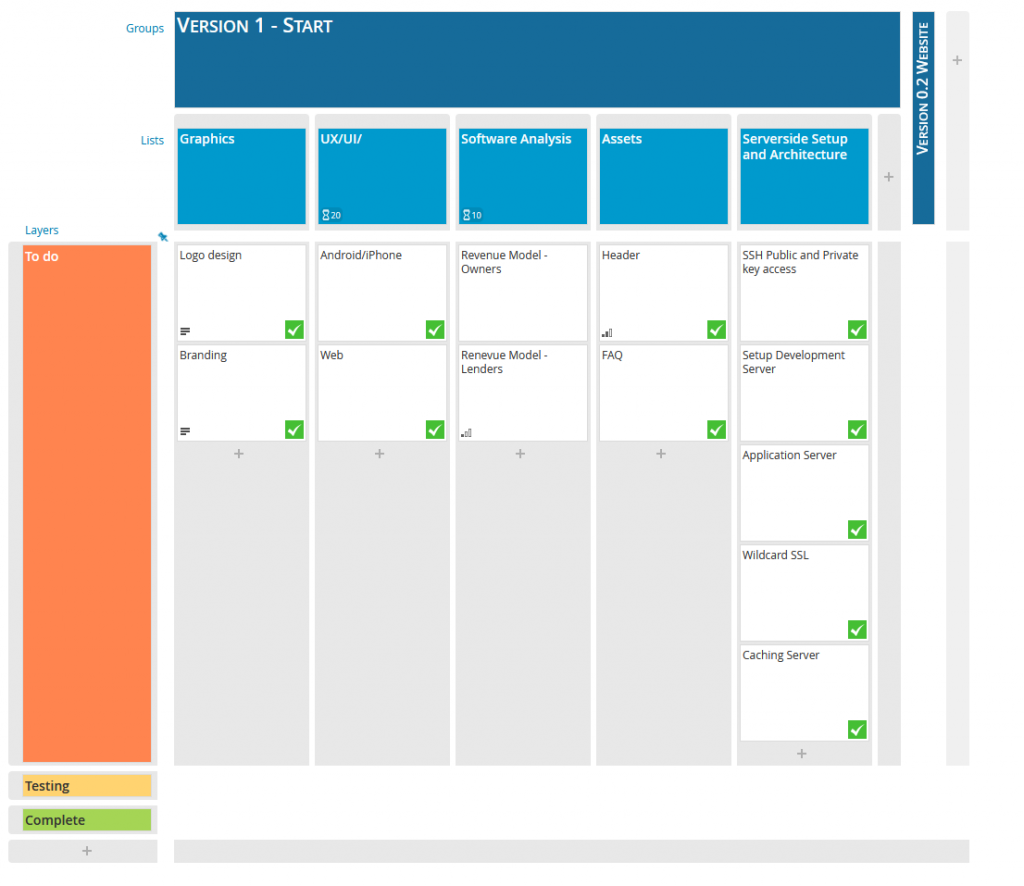
Map Layers that are collapsed are remembered
Quality of life updates will be seen frequently as we receive feedback and suggestions. Already we’ve released a mini addition (now officially on v4.0.1 at time of posting) that remembers the last active setting of your layers or groups.
Now when you collapse, and adjust the views, those layers/groups will remain collapsed when you return to the map or reload.
Layers: Testing and complete are collapsed and will be remembered upon reload. Group Version 0.2 Website is collapsed and will also be remembered.
Sign in with Microsoft or Google accounts
Passwords can be a pain. We get that. Why not just log in to FeatureMap using your existing Google or Microsoft account ?
Linux support
For those of you interested in using FeatureMap on-premises, you can now install and run the application on Linux servers and not just Windows.
Anything else? What’s next?
We made a lot more changes that are not directly visible right now. These will allow us to release some long-requested features in the near future. Here are some of the improvements we are already working on:
Custom tags for your cards
A more modern look for FeatureMap
Quicker actions on cards: copy-paste, move, or update several cards at once
Dedicated workspaces for teams
Organized dashboard
Please send feedback and get involved with our roadmap.
It is essential that Product Owners in 2021 have a wide variety of skills. Soft skills (skills that are hard to measure) and hard skills (easily defined and specific skills).
Soft skills (such as communication, leadership, and creativity) and hard skills (like sales, data handling, and proficiency with development tools) both help create the best Product Owner. Gaining experience and knowledge in both skills is challenging and rewarding, but the soft skills are naturally harder to define and therefore harder to measure improvement.
The role of a Product Owner is to lead, defines the work flow of the project, organize and prioritize the backlog of the team and streamline the project while maintaining the conceptual and technical integrity of the product. Heaps of hard skills, glued together with that all important management of individuals via soft skills.
A product owner can however help themselves with the use of Tools which complement and enhance those soft skills. User Story Mapping, and the use of creating a map and running a mapping session with the entire team, can really help boost and compliment your backlog management or project planning.
In LinkedIn’s ‘The Most In-Demand Hard and Soft Skills of 2020’, the top three soft skills are creativity, persuasion and collaboration. Three top skills that are required in Product Owners and Project Management.
With User Story Mapping and FeatureMap, you can give your creativity a boost as you create a map with ease, layout your product in easy organized cards, columns and utilizing the basic Agile design. Linking in immediately you can super up your collaboration as you bring your team members onto the board, and your entire broader team can fill in their own user story journeys, discussing and building a map together.
Seeing the bigger, larger, broader view of a project gives your decision-making and leadership a boost.
With the broader view, and bigger picture, you can give your persuasion and leadership that supported weight and sell your decisions to your team and stakeholders.
As a Digital Product Owner, you are at the helm of the product.
You will be the one responsible for ensuring the product is on track, and the product vision has been achieved.
User story mapping is an agile methodology with a focus on product design/development. It doesn’t stop there, but in this article we’ll focus on product design. Designing with user story mapping is one of the secret weapons to create a user-centered product. The product design process always begins with first understanding the problem and the user’s goals. The power of this, is the ability to spec out multiple users, mulitple goals and clearly display our entire process whilst following a natural, narrative flow of the users journey.
User Story Mapping can be narrowed down to organising user goals, activities, and user stories. This can help your product flow or backlog and create an visual backlog, that everyone understands.
Why is it important to create a User Story Map for your project?
Your customers need a simple way to confirm product goals.
Your teammates benefit from such a straightforward platform.
Teammates can get access to the entire scope and see and add valuable ideas.
Developers can see the entire specification for the product.
To sum up, user story maps are the visual aid to building shared understanding between project members.
Creating a user story map can take time, but you can follow a pretty clear and logical process, with a good efficient start you’ll be ahead in no-time. This could be a solo task, but to the absolute advantage of a user story map is to use it as a tool to have discussions with your wider team team.
What you’ll need: Grab your team, your VOIP of choice, boot up a brand new Map (Create from scratch) and sit back with a meeting blocked out for the team.
Do note, this is not a presentation but an involved group activity, so be mindful of voip etiquette.
Step 1: Frame the journey
Before you start mapping, you want to frame the exercise around a common goal. This could be your product vision or the goal of a specific feature you’re mapping out.
One of the simplest ways to do this is just to ask: What does our product do?
If this feels too big or gets too unwieldy, think about some constraints you can add to your user story mapping session:
What? – What problem are you trying to solve? What product do you want to build or what feature do you want to add?
Who? – Is there a specific user or user group you’re building for? Who are your potential customers?
Why? – Why build this for the user? What is the benefit to your team and company for building this feature or product? How will giving users this add value to the bottom line?
Talk it through and make sure everyone understands the vision and overarching goal of the user story mapping session.
Be aware, you may find such varied views from each other this may outline some sticking points from the get go!
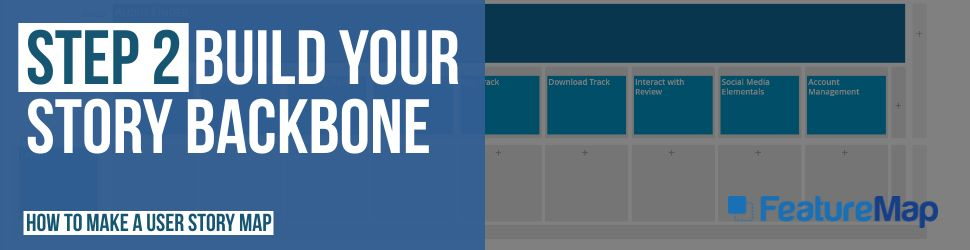
Step 2: Build your story backbone
The backone of your map covers the entire journey described in high-level tasks or steps from start to finish. Don’t get too detailed, that comes at a later task. Go wide, not tall. Discover your goals and map your journey.
As an example, let’s say we’re building a product that helps someone buy a record track. At the highest level, the steps they take are:
Sign up for an account
Search for the track by genre/year/artists/album
View/listen to the song track
Enter payment information
Buy track
Download track
Interact with social/stars/review of track.
Each feature or step can get more indepth later and expand out with sub headings, cards and individual descriptions.
Your product is probably a lot more complex. Here are few ways to help identify your backbone:
The expert details the journey: Ask one of the subject matter experts to walk through the problem step-by-step. How do they tackle this? What steps do they take and what tasks do they perform?
Everyone creates cards and inputs on the map: As you create cards on FeatureMap, get each familiar team member writing their own cards and detailing their journeys. Everyone can input the steps that need to be taken and add them to the map. Don’t worry about duplicates now, as this may highlight misunderstandings or merge tasks to a better project flow.
Brainstorm with your team to collect the most possible solutions and put all user stories under the related steps.
Once complete, think about the ideal user flow. The use case. Does the map fit and cover all steps for the journey?
What if you’re working with an existing backlog? If you have a backlog full of well-written user stories you can simply add them into your map. In some cases, this might even be the majority of your steps and you could utilise an API, or import features from JIRA or Trello.
Step 3: Identify and group your cards
As you look through the steps your user takes, you’ll start to notice some common groups, or activities that could be placed within groupings. In user story mapping, we call these activities.
Your activities (also known as user stories at this stage) are listed above the user steps (or epics) to make up your backbone.
As an example, lets return to our previous product of buying a record track. Here we can build out a step:
Search for a track by genre/year/artists/album
We can break this into individual cards of:
Search for a track
Search for an artist
Search for an album
Search within a genre
Search for a genre
Search tracks within a year, or a specific year.
You can see how these could all be individual tasks with a group of “Search for a track”. Here we can, with relative ease, start to identify user steps, user stories that all correlate to a user goal.
User Goal/Activity – Find a Track. User Step/Epic – Search User Story/Card – Search for an artist, then search for a track.
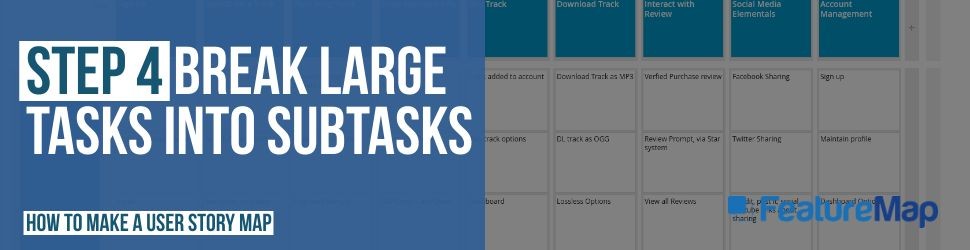
Step 4: Break large tasks into subtasks
It’s time to go a step deeper. The cards in your backbone are most likely too big to be tackled in a realistic single sprint. This step covers breaking down those cards and activities into smaller groupings and user stories.
Step 4 involves your team editing cards, splitting them into two, rewriting and reorganising them. Cards here could be reorganised and moved around the map. Placing cards into activities/sections/groupings will making it clearer for all involved promoting that shared understanding.
One key point of advice – Do Not Get Bogged Down!
FeatureMaps and User Story Maps are living, breathing things, cards get developed, edited, added to and when first mapping out the entire user story aim to cover it all at a higher level scope first.
Step 5: Fill in missing tasks.
This step has you expanding, checking for missing task, filling in the blanks.
Ask your teams if they are covered and user story is represented no the map.
One simple and effective test is to have someone walk through the scenario from a different user perspective. This is what is called utilising Personas. Act out the steps as your user and allow the team to highlight when missing steps/cards/goals are not on the map and have them add them.
Each department will see this differently, for example the graphics and UX design team may differ on presentation while the coders are thinking about stacks and the sales team are thinking about pain points and upselling.
If a team member states “Ah ha, this is missing or may cause problems…” then this stage is doing well.
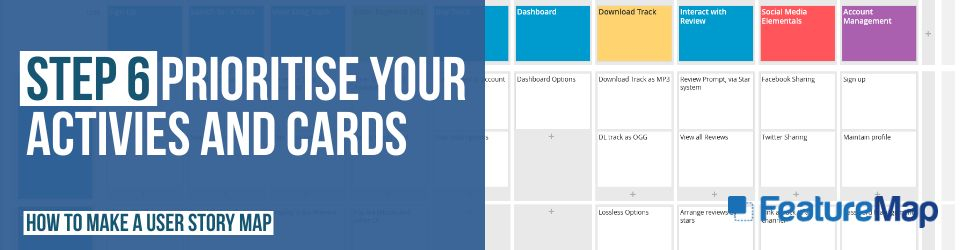
Step 6: Prioritise your activities and cards.
Your Map and backbone is how your users move through your product. Each section at this high level are equally important, building blocks to the entire product/project.
Here you can easily see the whole picture and work with your team to find the best minimal viable product. This stage is ideal to figure out what has the highest priority, while allowing other sections to be put aside.. for now.
Now that you have the user map prioritised vertically, you can create horizontal “layers” that represent your MVP to Full release.
A good practice is to ensure that each layer should be creating value across each user and activity.
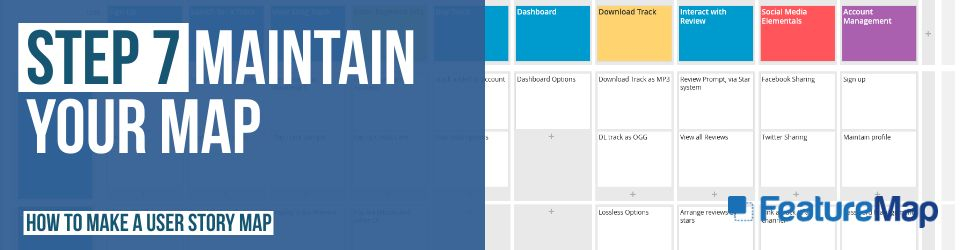
Step 7: Maintain your Map.
The last step covers using your living, breathing, evolving map.
Checking up your progress, see quickly the wider picture of your team.
Ensuring cards and tasks stay on track, assign deadlines to individual tasks and adjust work flow carefully.
In FeatureMap you can assign dates to tasks, cards or groups to keep track of progress.
You can assign cards to individual team members, and add progress status to each card, such as “todo, progress, done, etc”
You can expand and add timings or costings, or other custom metrics and utilise the aggregation tool which allows you to see the combined time within each sprint, grouping, or the larger map.
Audio Finder – A Fictitious Project about finding audio tracks and downloading them. Viewed as a User Story Mapping Board on FeatureMap.co