As a project leader, you know that Agile methodology is essential for successful software development. User story mapping is a prioritizing technique that helps teams understand the user’s needs and plan the development process. At FeatureMap.co, we offer an agile tool that simplifies user story mapping and streamlines the software development process. In this post, we’ll discuss the advantages of Agile methodology and explain how our tool can help you achieve your project goals.

What is Agile Methodology?
Agile methodology is a software development methodology that emphasizes flexibility, collaboration, and continuous improvement. Unlike traditional Waterfall methodology, which involves a linear approach to software development, Agile methodology involves iterative development and testing.
Agile methodology offers numerous advantages, including faster time-to-market, improved quality, increased customer satisfaction, and reduced risk. By using Agile methodology, teams can respond quickly to changing requirements and deliver software that meets the user’s needs.
User Story Mapping
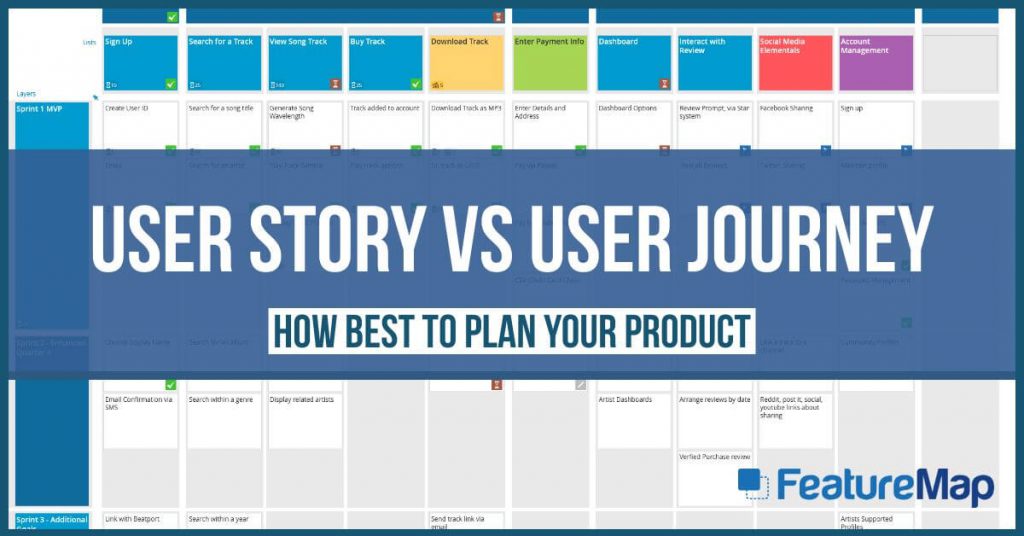
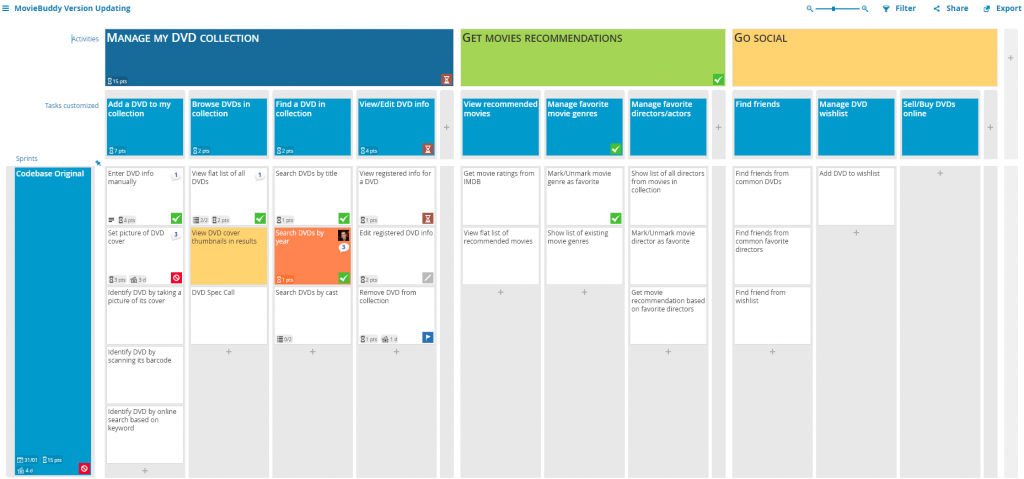
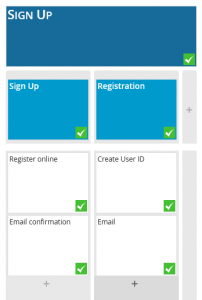
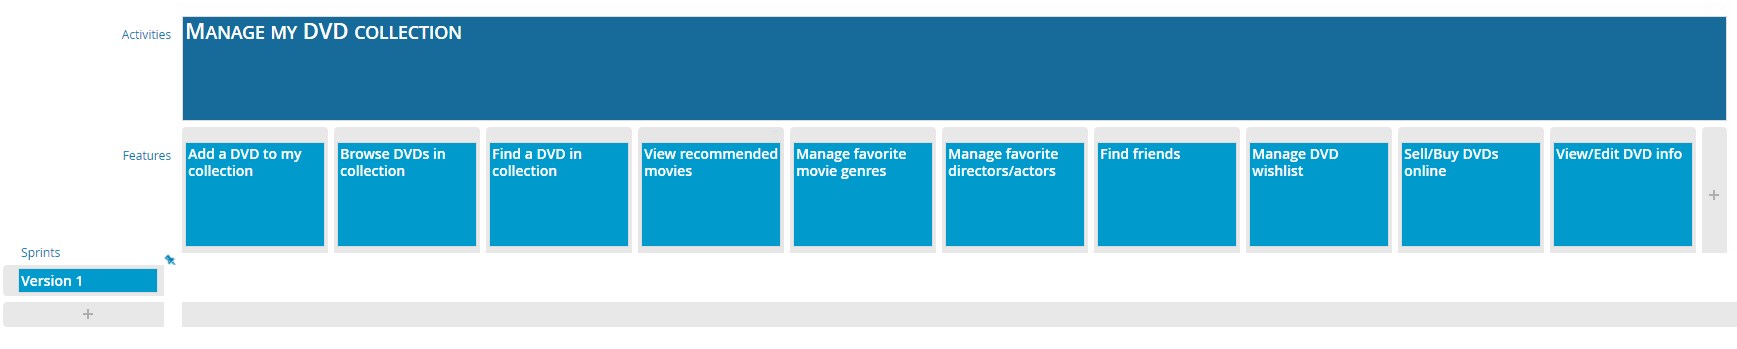
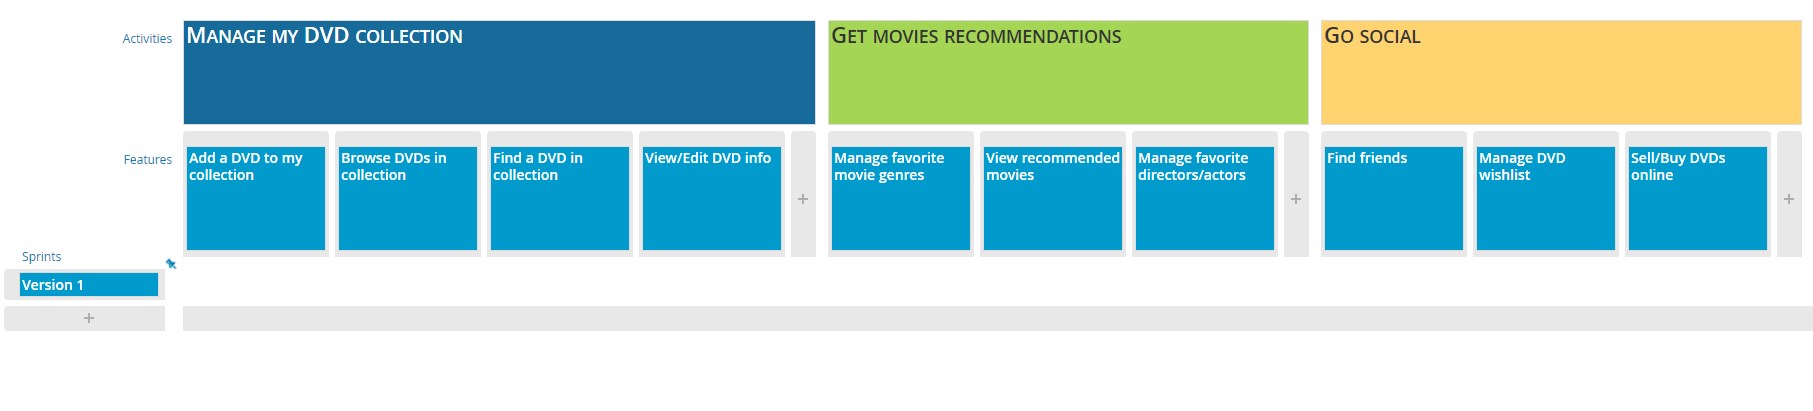
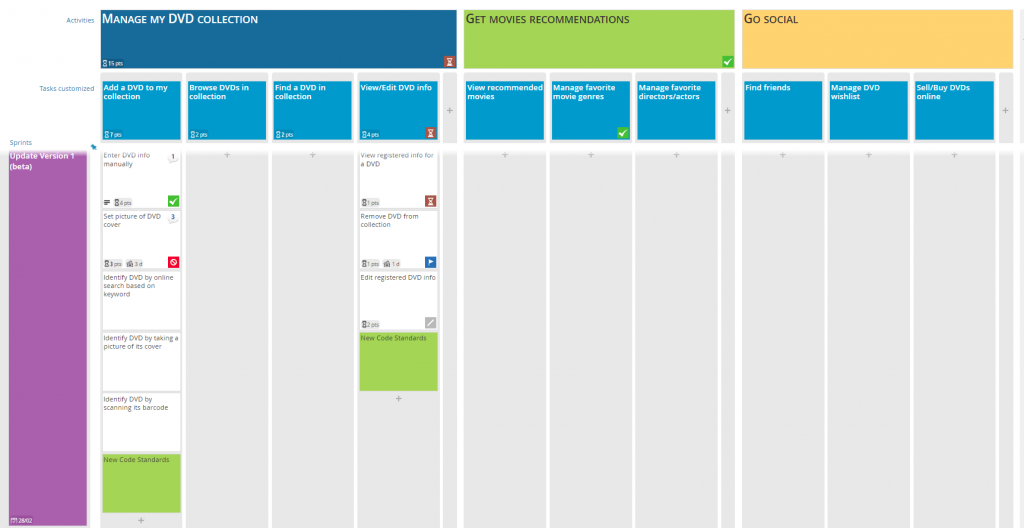
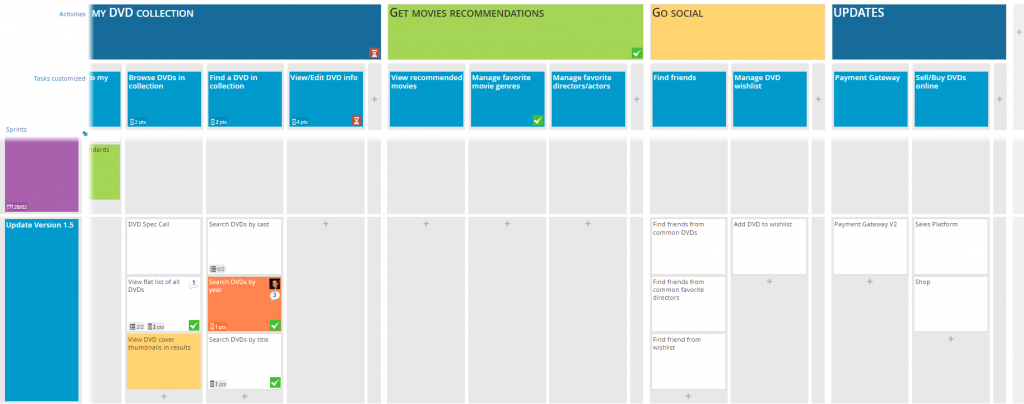
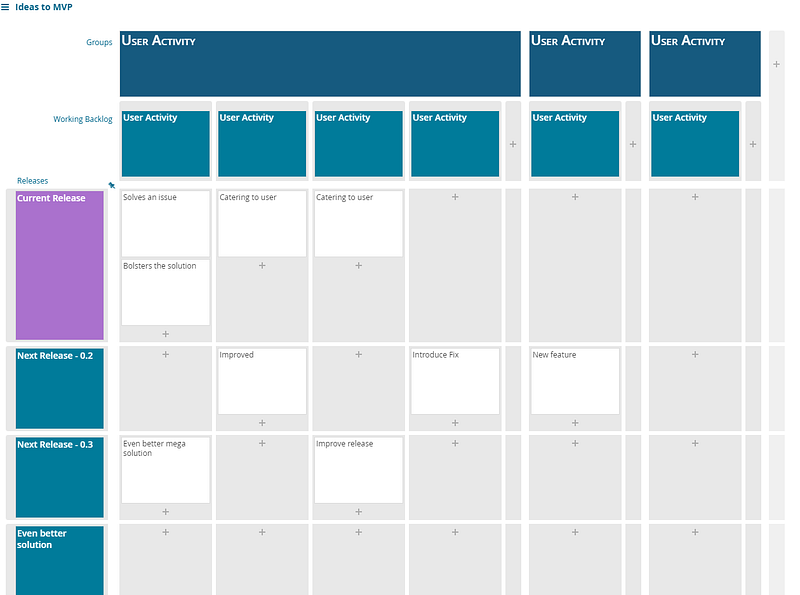
User story mapping is a prioritizing technique that helps teams understand the user’s needs and plan the development process. It involves breaking down the user’s requirements into small, manageable stories that can be completed in an Agile sprint. User story mapping ensures that the development team is focused on delivering features that are valuable to the user.
For example, imagine that you are developing a project management tool. Your user stories might include creating tasks, assigning tasks to team members, and tracking progress. By breaking down the user’s requirements into small stories, you can prioritize the features that will provide the most value to the user.
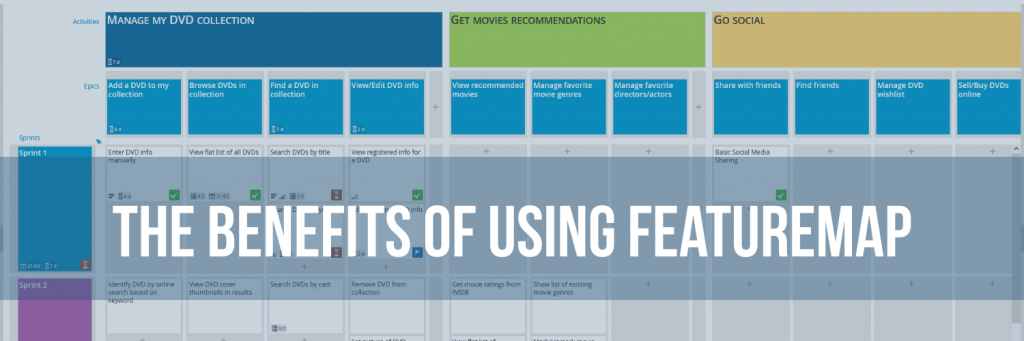
The Benefits of Using FeatureMap
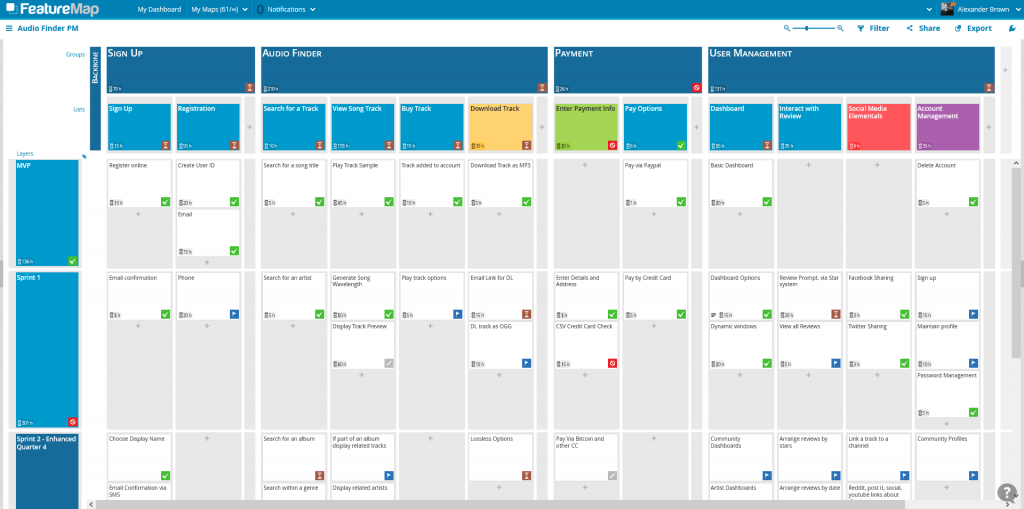
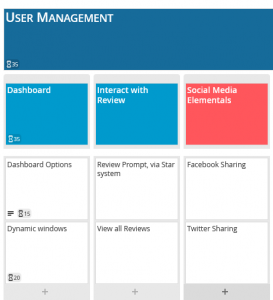
At FeatureMap, we offer an Agile development software that simplifies user story mapping and streamlines the software development process. Our tool offers a collaborative environment that allows teams to work together seamlessly, ensuring that everyone is on the same page.
Our tool is easy to use, even for teams that are new to Agile methodology. With real-time tracking and prioritizing features, our tool ensures that everyone is working towards the same project goals.
How FeatureMap’s Tool Can Help with Agile Project Plans
Our tool offers numerous benefits to Agile project planning, including:
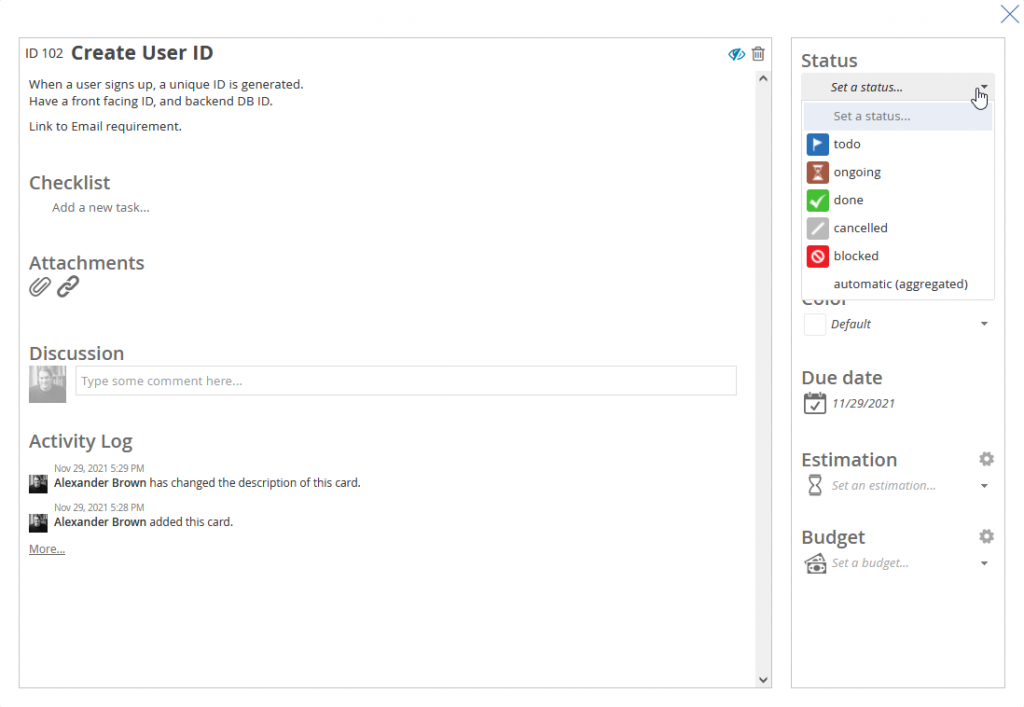
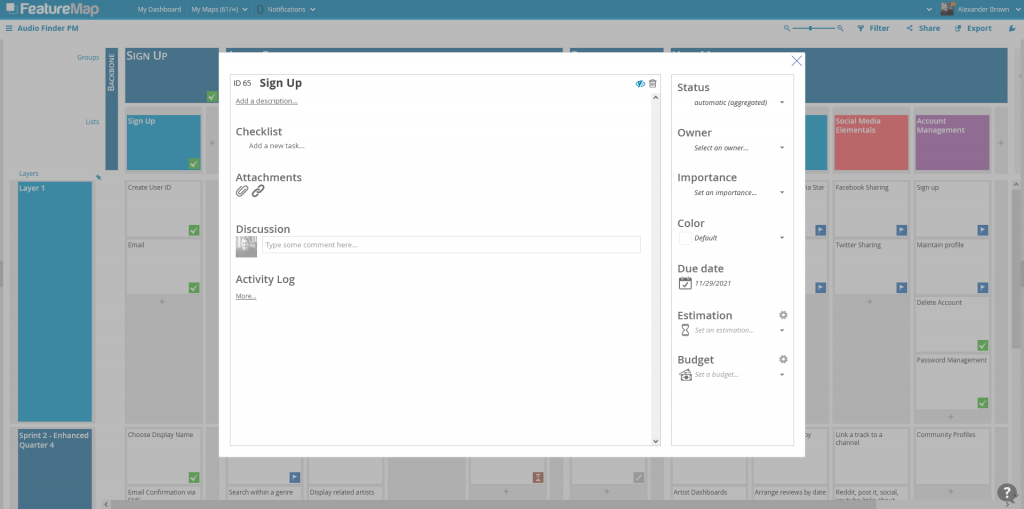
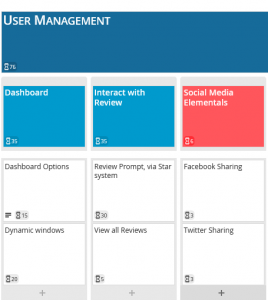
Prioritizing features: Our tool makes it easy to prioritize features based on user needs, ensuring that the development team is focused on delivering features that provide the most value.
Creating a shared understanding: FeatureMap helps teams all get on the same page by seeing the visual big picture.
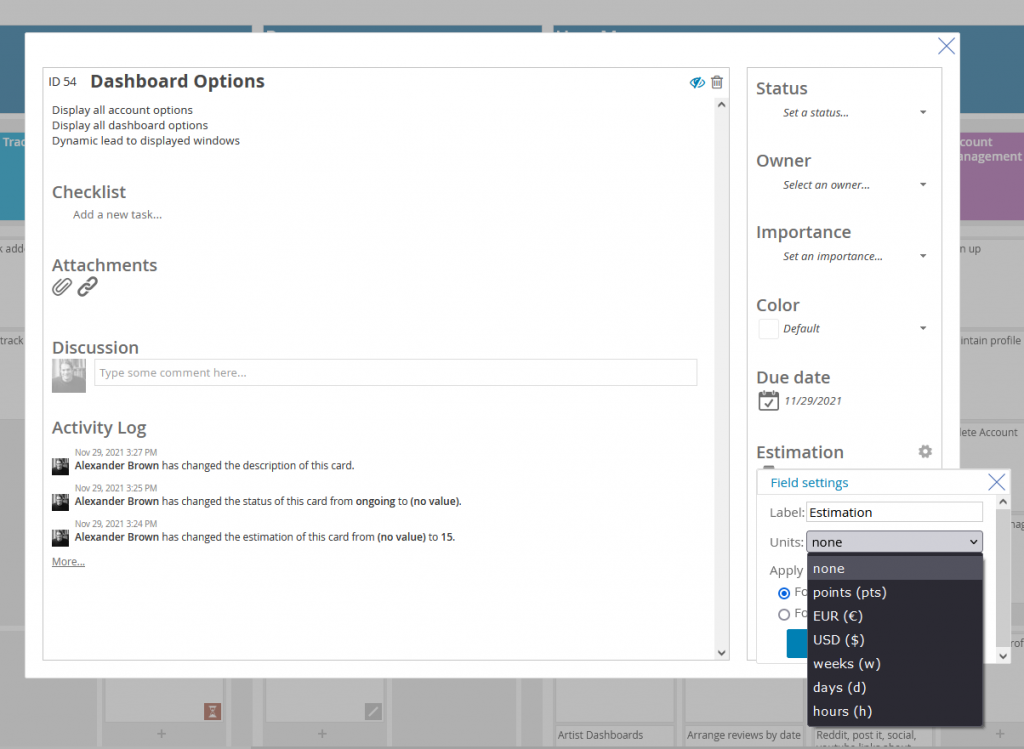
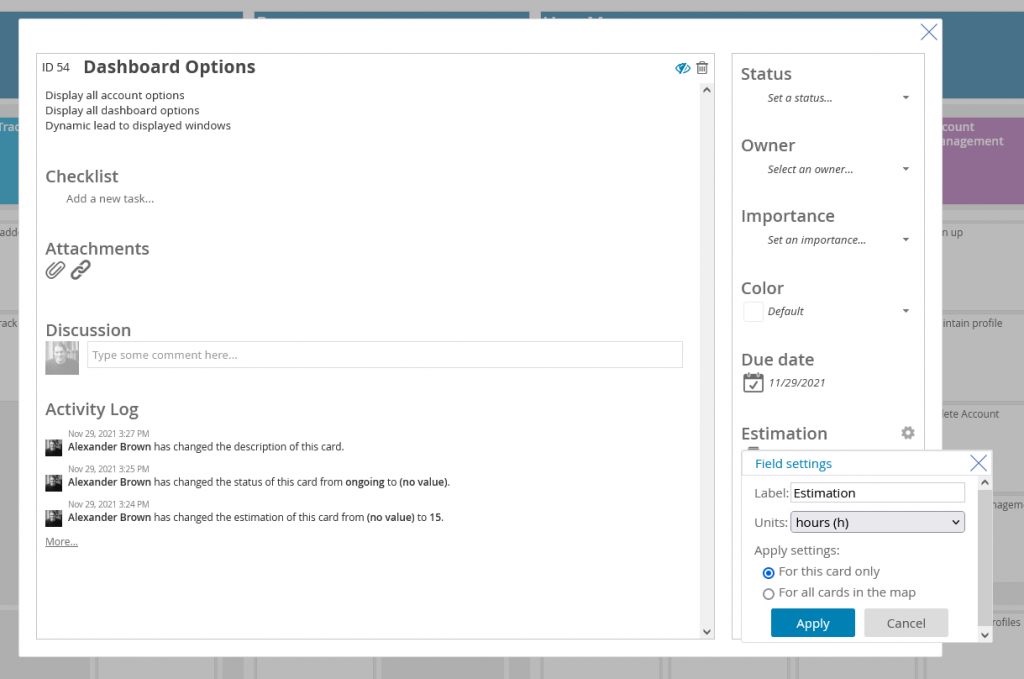
Story points in Jira: Our tool integrates with Jira, allowing teams to track their progress and estimate the time required to complete each task.
Real-time tracking: Our tool offers real-time tracking of progress, allowing teams to identify and address issues quickly.
So what next?
Agile methodology is essential for successful software development, and user story mapping is a key prioritizing technique that helps teams deliver software that meets the user’s needs. FeatureMap’s Agile development software offers numerous benefits, including a streamlined development process, a collaborative environment, and real-time tracking. If you’re looking to improve your Agile project plans, we encourage you to try it out free today.