Learn User Story Mapping with these games

Are you tired of feeling overwhelmed by your backlog and deadlines? Do you want to improve communication and alignment among your team? Look no further! A User Story Mapping Workshop is the perfect solution. Not only will it help identify problem areas, but it’s also easy to teach and can be introduced with a simple game.

In just 30 minutes, your team will learn how to use this powerful technique to make the most of their time and effort. Don’t let fear of the unknown hold you back – give User Story Mapping a try and watch your team thrive!

Teaching User Story Mapping to your team can seem a little daunting to newbies when you first pull up a full FeatureMap. Luckily, User Story Mapping is easy to teach, and I have a great simple exercise to walk your team through as an introduction.

The technique is innately simple and can be taught with one simple game (because if we say game instead of exercise, it sounds better, right?).

I have some exciting and engaging 30-minute games that you can use in your teaching workshop or as a starting point for a User Story Session. These games will not only help your team develop a better understanding of User Story Mapping, but they’ll also have fun and build team cohesion along the way. So why wait? Add some fun and learning to your next workshop and watch your team thrive!

How to conduct a User Story Mapping session and teach!

How to teach User Story Mapping with a game

Running a user story mapping session is fairly straight-forward and you can get sorted quickly.

Here is an easy set of instructions broken into 8 steps:

  1. Begin by explaining the concept of User Story Mapping and its importance in the product development process.
  2. Provide an overview of the steps involved in conducting a User Story Mapping session, including how to identify user needs and create a shared understanding of the product vision among team members.
  3. Divide the participants into small teams and give each team a scenario, such as developing a new mobile app or a website for a small business.
  4. Ask each team to brainstorm and identify the different user needs and goals that the product should address.
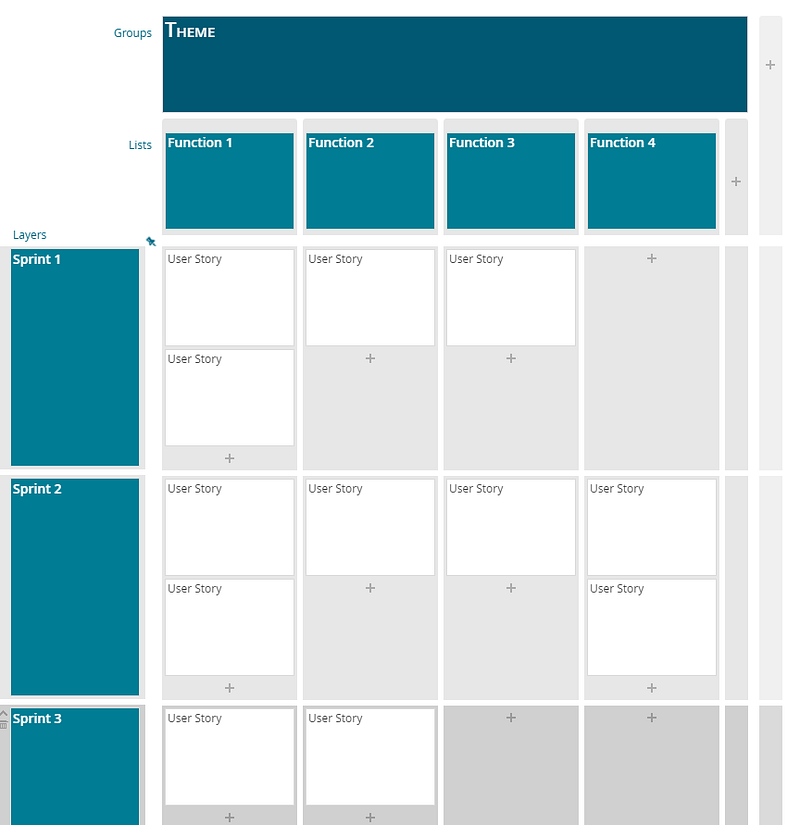
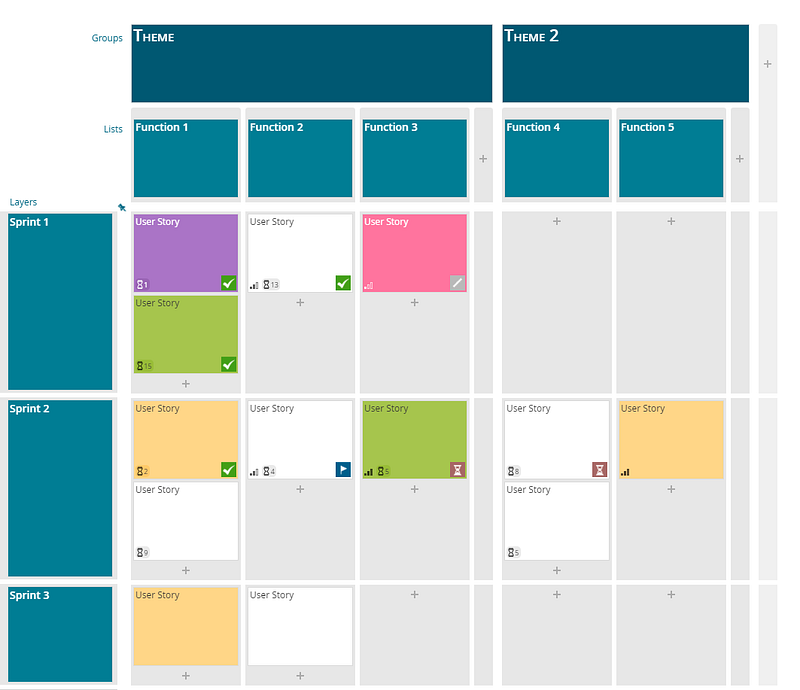
  5. Have the teams create a rough draft of their User Story Map, using sticky notes or a whiteboard to organize the user stories into columns representing the different phases of the product development process (e.g. planning, development, testing, etc.).
  6. Ask each team to present their User Story Map to the group, explaining their reasoning behind the organization and placement of the user stories on the map.
  7. Facilitate a group discussion to identify common themes and areas for improvement in the different teams’ User Story Maps.
  8. Conclude the exercise by summarizing the key takeaways and reinforcing the importance of conducting User Story Mapping sessions as part of the product development process.

By participating in this exercise, team members will gain hands-on experience in conducting a User Story Mapping session and will learn how to use this tool to create a shared understanding of the product vision among their team.

Get to Work!

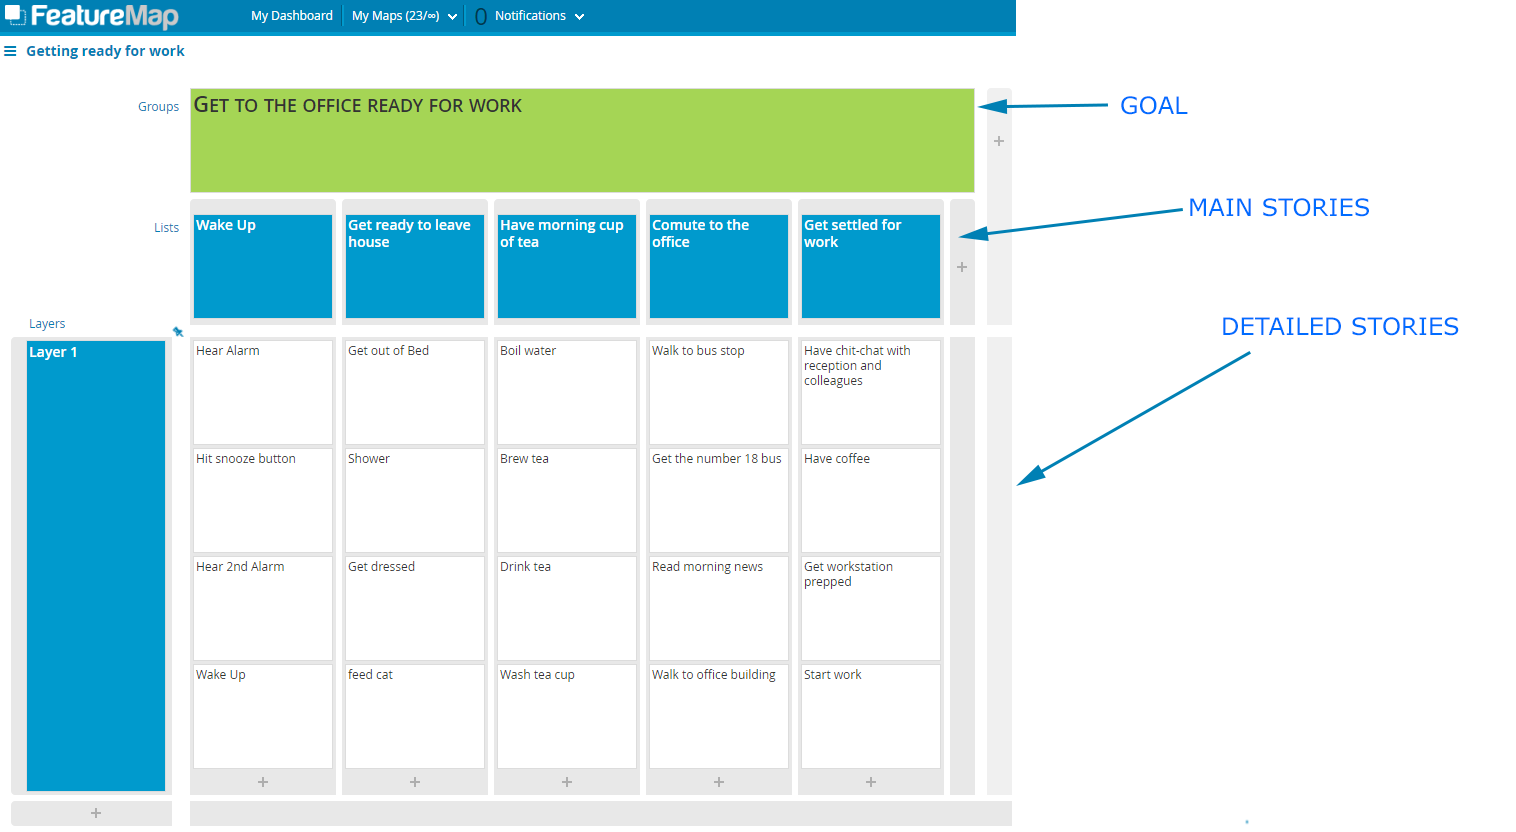
One of the easiest and well known games is the “Get to work” or “Wake up in the morning” tasks.

You write out on your map what you do each morning. This can be broken down to the most mundane steps.

I once had a team member write out everything they did which included an impressive rising time of 4am and 3 hours of morning preperation. I have since added to the challenge that they only have 20 minutes to get up and to get out the door to get to work.

What you can do is expand the task to reduce the time available, and to extend the time available to experience with what they add and cut aka minimal viable product! 😉

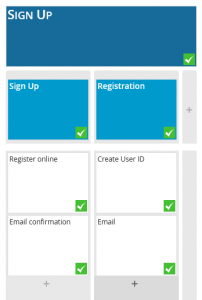
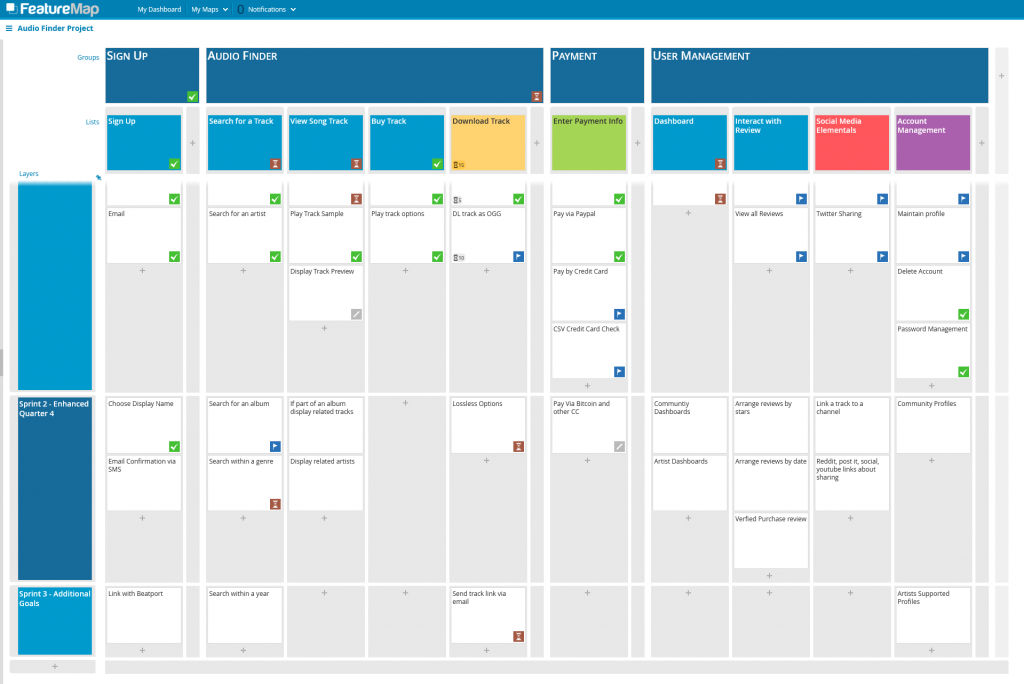
We have a map here of an example of our “Get to work”

The Jigsaw Piece Game

The Jigsaw Piece Game to help learn story Mapping

Another game that can be used to introduce the concept of User Story Mapping without the need for cards is called “User Story Jigsaw.” This game involves dividing the participants into small teams and giving each team a set of user stories that are related to a specific product or project. The teams must then work together to organize the user stories into a logical sequence that represents the product development process.

To play the game, first, create a set of user stories that are related to a specific product or project. These user stories should be based on the real-life challenges and needs of the team or organization.

Next, divide the participants into small teams and give each team a set of user stories. The teams should then work together to organize the user stories into a User Story Map, using sticky notes or a whiteboard to create columns representing the different phases of the product development process.

The teams should then place the user stories onto the map, trying to create a logical sequence that represents the flow of the product development process. The team with the most effective User Story Map wins the game.

After playing the game, the teams can discuss their User Story Maps and compare them to see how they differ and what they can learn from each other. This discussion can help the participants gain a better understanding of the concept of User Story Mapping and how it can be applied in their own work.

Tic Tac Toe Game

the tic tac toe game to learn story mapping

another game that can be used to introduce the concept of User Story Mapping is called “User Story Tic-Tac-Toe.” This game involves creating a grid with different user stories written in each square, and then having the participants take turns placing their “X” or “O” on the grid to organize the user stories into a logical sequence that represents the product development process. The objective is to create a User Story Map that covers as many squares on the grid as possible, with the winner being the team that creates the most effective User Story Map.

To play the game, first, create a grid with different user stories written in each square. These user stories should be based on a specific product or project that the team is working on.

Next, divide the participants into two teams and give each team a set of “X” and “O” markers. To begin the game, one team should place their “X” on the grid, choosing a user story from one of the squares. The other team should then place their “O” on the grid, choosing a user story that is related to the first user story.

The teams should continue taking turns placing their markers on the grid, trying to create a User Story Map that covers as many squares as possible. The team with the most effective User Story Map wins the game.

After playing the game, the teams can discuss their User Story Maps and compare them to see how they differ and what they can learn from each other. This discussion can help the participants gain a better understanding of the concept of User Story Mapping and how it can be applied in their own work.

Final Tips for your Workshop Games

Using games and exercises to teach any product or methodology will be met with variation. Be aware of your audience, what will work and tailor your tutorials to fit them.

Some important tips for running these games.

  • Clearly explain the objective and rules of the game at the beginning to ensure that all participants understand what is expected of them.
  • Encourage collaboration and teamwork among the participants, allowing everyone to contribute their ideas and perspectives to the User Story Map. Try to discourage any“leader” roles who make all the decisions, let the entire team contribute.
  • Provide guidance and support to the teams as needed, helping them to understand the concept of User Story Mapping and how to apply it to their own work.
  • Focus on keeping time for each exercise to be utilised well, we often recommend under 60 minutes.
  • Use a variety of tools and materials, such as sticky notes, whiteboards, and digital tools, to allow the teams to create and organize their User Story Maps in the way that works best for them.
  • Debrief after the game to discuss the teams’ experiences and what they learned from the exercise. This can help reinforce the key takeaways and provide additional insights and guidance for applying User Story Mapping in the future.
  • Consider providing additional resources and support for teams that want to continue learning and practicing User Story Mapping after the game or exercise is over. This could include access to online tutorials, workshops, and other learning materials.

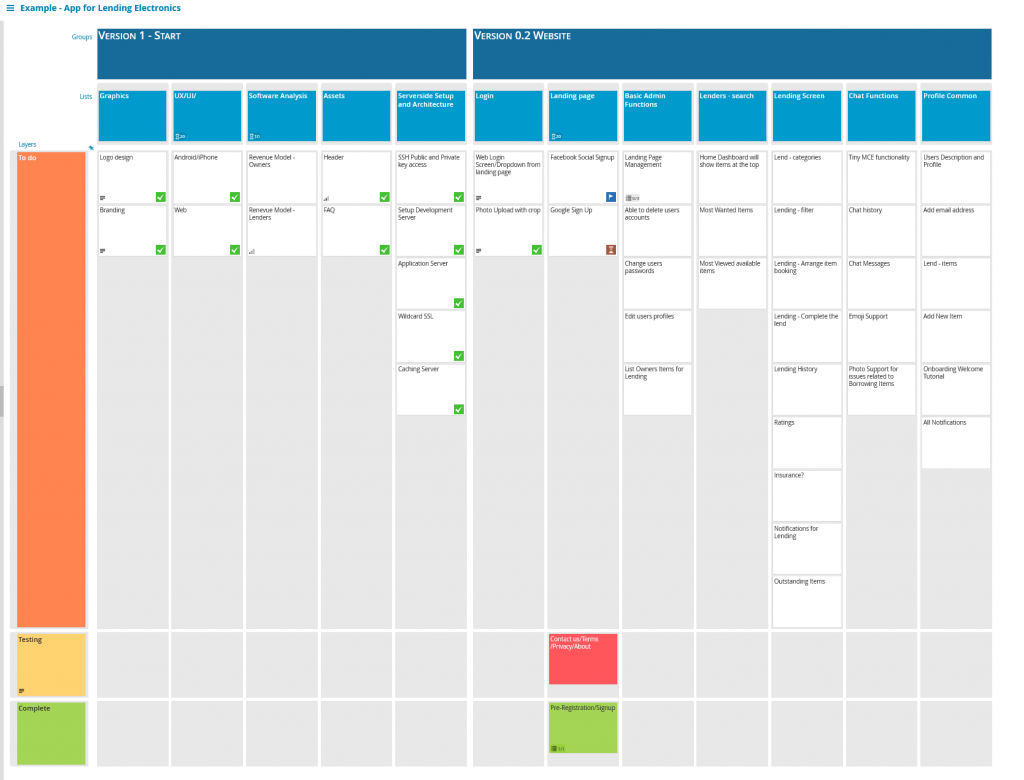
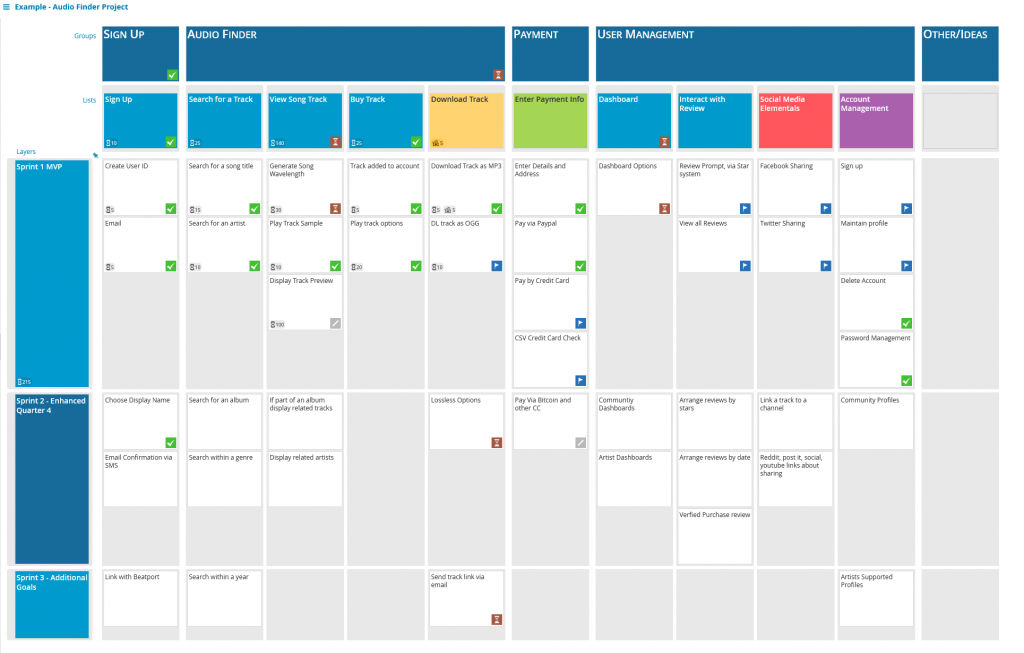
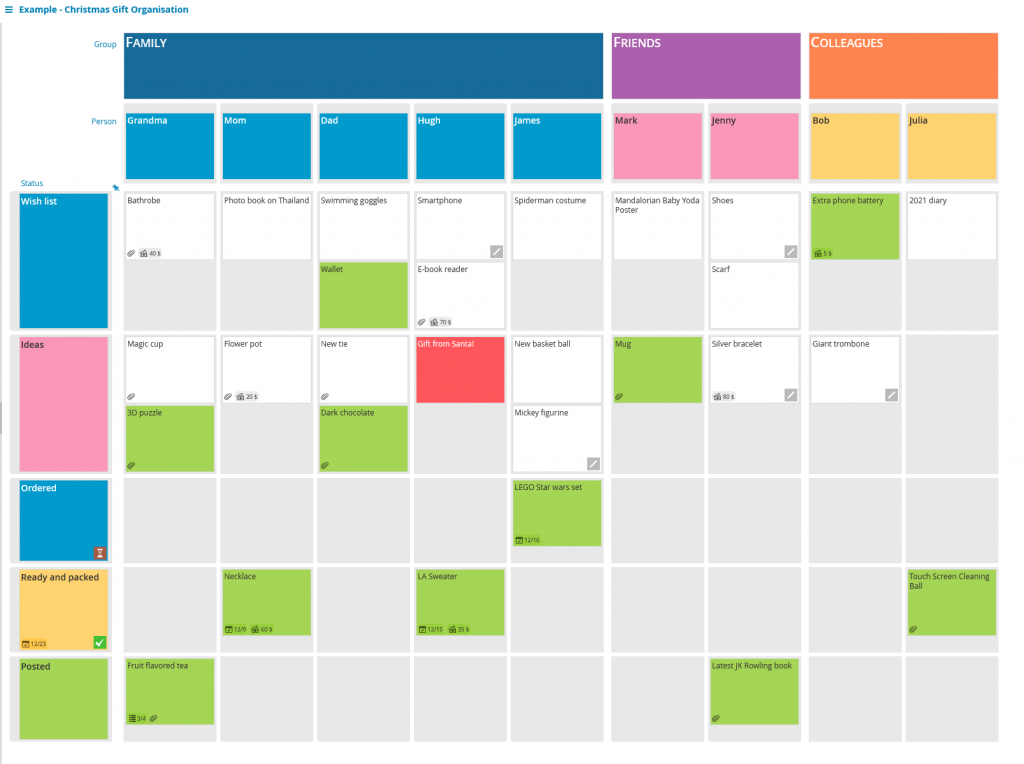
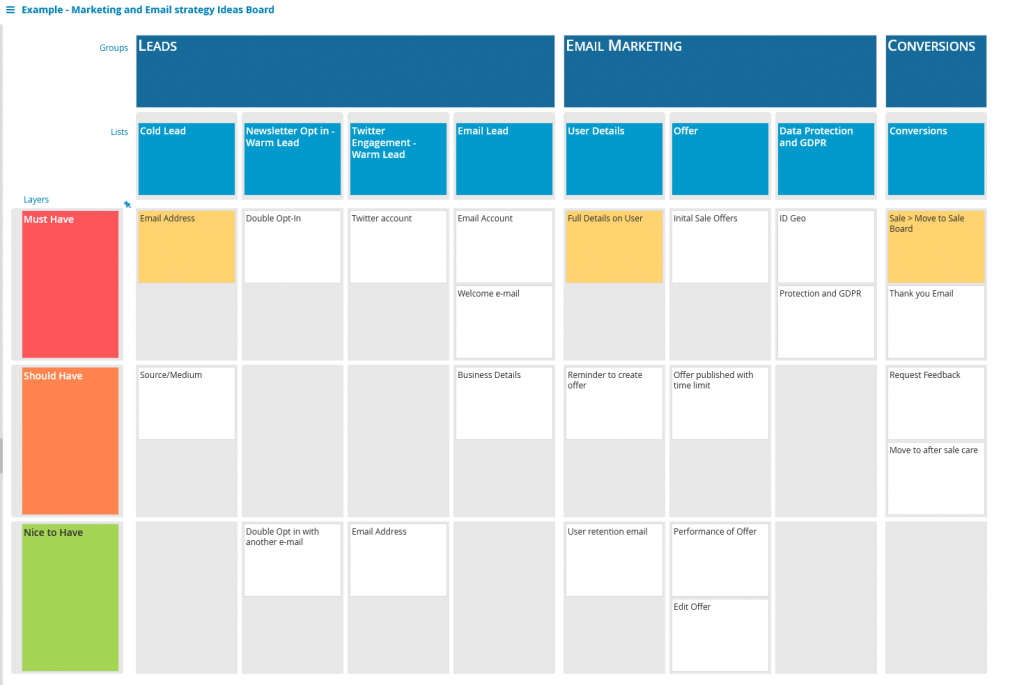
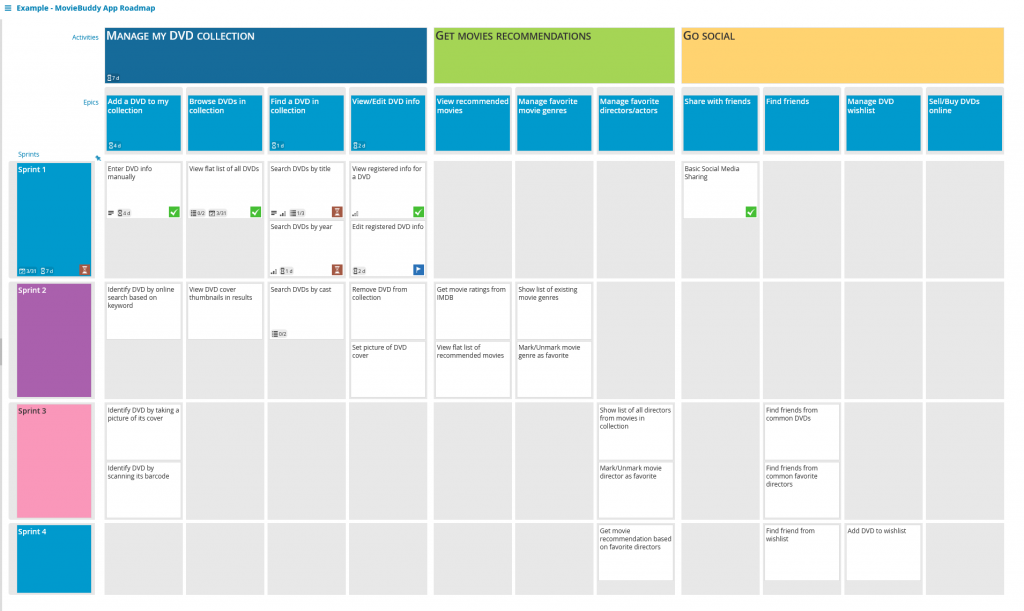
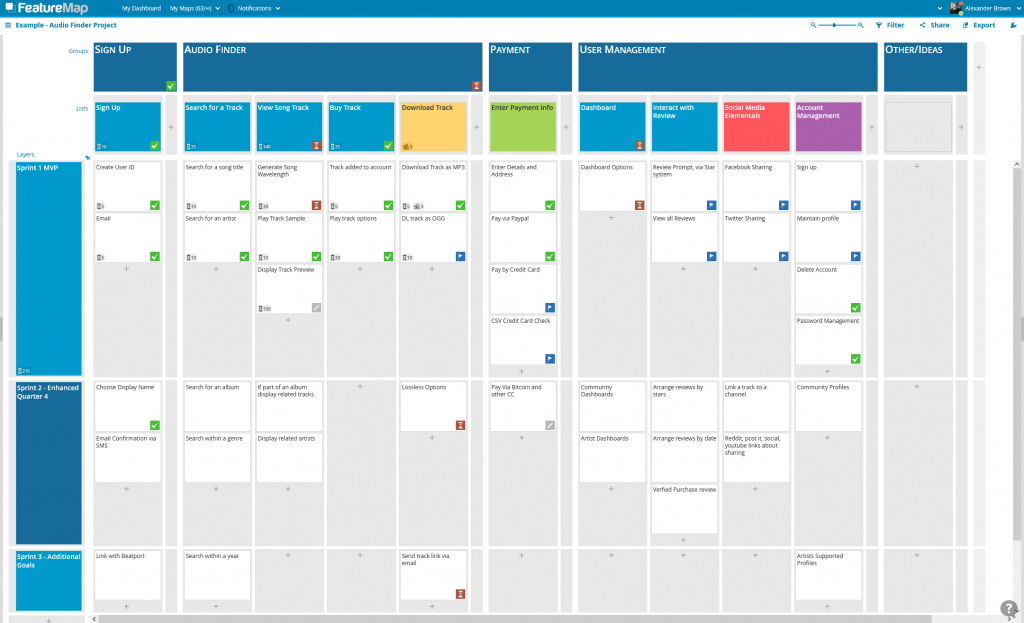
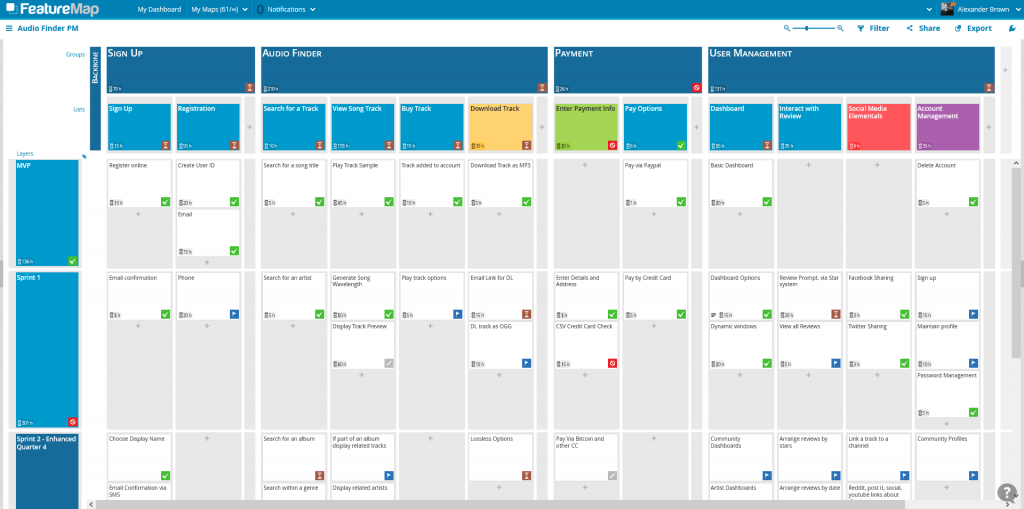
User Story Mapping is innately simple, with a huge range of depth that can be demonstrated in deep and powerful maps. If you need more assistance or ideas, check out how some of our templates to inspire.

Have fun, you got this

Good Luck!

FeatureMap Example Templates

FeatureMap offers you the tool for User Story Mapping Methodology, but at the same time, a canvas of possibilities in how you approach your maps’ organisation.

Sometimes you just need to see a bit of inspiration or examples to understand the scope of the tool.

We have a set of examples of how to best build your map.

Application for Lending Electronics

This is Product Owners roadmap for a development team, it was specced out and covered a tool that was designed to share and lend electronics in the local community.

The team using FeatureMap came together from all departments and built the customer journey.

A Product Owner’s Roadmap

Audio Finder Project

This is a project manager’s backlog for work to be completed on the application to find and purchase audio files, and mp3s. This is a snapshot of the tool under development with it’s MVP defined and work midway through it’s first sprint.

The tool was picked up by the new team as it had stalled, the new team used FeatureMap to define the MVP and continue forward.

A project manager overview

Christmas Gift Organisation

This is a fun tool that one of our developers created to help them go shopping for Christmas. They literally created a list of people, ideal gifts and a process to keep on top of making their holidays stress-free.

It’s a fun map, and shows that you can bend FeatureMap to really cater to all sorts.

A self project management list

Goals Listing for App

This is a map designed to be the users UX flow through the first opening and learning of their application. It is designed as a goals orientated application, a to-do list app.

The solo dev, wanted to clearly see a path of what the persona of a user wanted to experience. They then were able to outline and define the steps and convert the journey into a sprint.

User journey flow for UX planning

Marketing and Email strategy Ideas Board

This is a map that a project manager and marketer created to help them identify a workflow and the requirements. Instead of a MVP and sprint, they operated with a very human “Must Have, Need and Nice to have” flow, allowing a bit of freedom while helping one another adhere to a set of rules.

It’s a step away from the usual design of what FeatureMap was made for, but as we said at the start. FeatureMap can be a canvas and only limited by your design.

A project manager implementing a system using a map.

MovieBuddy App Roadmap

Moviebuddy has been our go-to example for years. It’s from a product owner’s perspective, but also caters to the entire team.

MovieBuddy is an application to build a list of your movies for record keeping. The map expands, both through sprints horizontally, but also vertically it explores new features, sections and upgrades.

In the map you can see how it grows from being a simple record keeping piece of software, to a software for sharing, compiling automatically, finding new recommendations, complex listings and integrated wish lists.

Take a look and it may just inspire you.

Moviebuddy is our original example, it shows a fleshed out map of sprints and features.

So now its your turn…

You have some examples, some inspiration and hopefully some ideas.

If you’ve made a map, or a new design, reach out to us and share with us the map and template.

One beautiful benefit of FeatureMap is having maps shared with us and seeing the new and wonderful ways that imagination has been captured and put down into a map.

Happy Mapping all!

Plan out your Product Feature Map in 1 hour or less

Creating a product map can feel intimidating, but with the right tools, it can be completed in no time. A systematic planning process and the right tool can get your project plan mapped out and finished in less than an hour.

A product map answers three basic questions:

  • What activities do you need to do?
  • Who will do these activities?
  • How long will these activities take?

It’s super easy, and it’s even better when you bring a team along with you to get started.

So how to start?

Step 1: Define your product

A story user map can be used as a method for visually outlining your roadmap for your product.

You will need to think of your product in stages, from high level to detailed level. Break your product down to varied groupings, then into steps, and then into further detail. Turn these steps into cards.

Product owner, testers, technical lead, customer support, architect, developers, UX/UI designer, sales and marketing, etc. All have their own techniques and requirements which will help you create your map.

With the questions above, what, who, why.

Step 2: Build that Map out.

If you are brand new to user story mapping, we have a short and sweet exercise. Let’s take a simple real-life example of “getting ready for work”.

The Story Map of Alex’s Morning
  1. Start with the goal.
    What is the story map about?
    What are you trying to accomplish?
    The main overall purpose.
  2. Second, list your main stories, your main tasks or activities. From left to right, insert the main steps of the story map that need to happen.
  3. Move on and detail each main list – column by column, left to right.

In the case of product features, the layers can be then developed and then bingo bango. Done.

In a simple step you have your Product Map of high level tasks.

Product Map complete.

And it’s only step 2… granted the product map would have been done as soon as you applied your main stories and really its more like step 3 if we need drag out tasks, but really… User Story Mapping as a tool for Product Maps offers a value you can only understand once it is underway.

If you want a more in-depth guide, broken down into detailed 7 steps, check out our guide here.

Step 3: Now you have your Product Map – Let it breath!

Story User Maps are ideal for allowing a team to design out a product feature and reduce the need to go back halfway through development because XYZ requirement. Let the project develop, evolve and change into larger, bigger projects or features.

You can develop and maintain any feature creep by creating new cards and assigning them into new sections.

You can add new requirements and manage the product map by assigning times, values, budgets and aggregating those values to the higher level cards.

The product map can become the defacto aid and tool in all your roles as Producer or CTO!

When building your story map approach it from all roles, if alone think about each responsibility in an order and feel free to create duplicates to then merge later. It’s about going with the flow and giving creative freedom to fleshing out a detailed product map. You can always edit, merge, delete in a later step. Due to their different foundations and interests, all roles have valuable points of view. As well as when working collaboratively with a team, everybody has an unmistakable and common comprehension of what they are about to build together.

As an aside, for further reading, we covered a series intro to story mapping with a basic run down and a simple exercise taking you through the morning tasks and making a map that may help, also don’t forget to check out some good practises in going from Idea to MVP.

Examples

We have a two examples below.

One is the Audio Finder Project, a board finished, with MVP defined, sprints defined and using some aggregation on the cards. A good example to see a finished map.

Audio Finder, a product map example with a finished MVP and aggregation.

One is the App for Lending Electronics, a board and map which is in the stage of “undergoing fine-tuning” and shows an example of half the map with tags and status applied, while the other half is still in flux. A good example to see a map undergoing evolution.

Lending Electronics, a product map example in progress.

If you want to give making your product map a go, quickly, check out FeatureMap and start for free.

High-Level Understanding – Utilising Aggregation in FeatureMap

User Story Mapping and FeatureMap

User story mapping can allow your team to see and understand the product from a user-centric design. You can see the bigger picture of the product, help the team identify gaps and dependencies, and give the first framework of a shared understanding between your entire team.

A finished FeatureMap Board should have your entire product outlined. The team will have sections separated, and you’ll be scheduling and planning the outline of prioritized stories into sprints and releases. 

In this article, we will share how to gain a better shared understanding of a map by utilising the feature of aggregation.

In short, it is the option of aggregating values. On each card you can assign a status, estimation and a budget. When you assign the aggregation option to a header card, the card will gather the values of all sub cards and calculate, dynamically, the overall status or number.

e you can see the FeatureMap Board of the Audio Finder Product, fully incorporated with aggregation of both status and time.
Here you can see the FeatureMap Board of the Audio Finder Product, fully incorporated with aggregation of both status and time.

A beautiful map, full of information, which can be daunting, but with ease you can see if the product development has any issues just by looking at the aggregated dynamic values on each of the layer headers.

Let’s break it down.

Status Aggregation

With Status, you are able to assign to a card, displaying a coloured icon on the main map. Great for that easy acquisition when viewing the larger map.

The statuses you can apply are: Todo, Ongoing, Done, Cancelled, Blocked.

With FeatureMap you can set statues to all cards to help with task management.
The Card – Register Online: Applying a status for the state of its task.

With aggregation, you can apply the option “automatic (aggregated)” on your header cards, and the header card will a value by priority to display allowing the team to see each header, and associated higher task status.

A quick glance at a busy map can be even quicker with good application of status icons, and aggregation allowing you to identify issues and solve them quickly. This is one huge advantage for those busy product owners or leads 😇

The priority for aggregation display is by importance: Blocked -> Ongoing -> Done.

When a card is set to “To-Do” and “Ongoing” are is aggregated as “Ongoing”.

  • When a column or layer has a “Blocked” card, this takes priority and is aggregated as “Blocked” as to draw attention to issues.
  • When all cards within a column/layer are done, the aggregated value draws “Done”.
  • The status “Cancelled” is ignored.

You can see Sign Up has been set to Status - automatic (aggregated)
Automatic (aggregated) has been applied to this Sign Up Card (Header).

The header card (groups) Sign Up has been set to an automatic (aggregated) value.

The sub headers (lists), Sign Up and Registration are also set to automatic (aggregated).

The cards in those columns have all be seen set with “Done” status.

The value will dynamically be displayed based on the values of the cards within the sub-cards.

In this case, FeatureMap draws the values from Register Online and Email Confirmation.

Both are “Done”, so the value aggregated is “Done.”

Budget and Estimation Aggregation

The task status is not the only aggregation option. You can also track your assigned values of budget and estimation.

When you assign numbers to a card, and then aggregation to the header. It will draw vertically to each header group and list or, if applied to a layer header, it will draw horizontally to each layer. This allows you to see the overall bigger picture, but also a specific collection of times, costs or the main status of the project.

In this FeatureMap we are utilising Aggregation.

On the User Management Section, we are not aggregating status instead we are estimating the time it will take for our developers to code the described section.

You can see the Dashboard Options Card is estimated to take 15 hours, and the Dynamic Windows Card is estimated to take 20 hours.

The header above – Dashboard draws those numbers and calculates both, giving us 35 hours. At a quick glance, the team now know the Dashboard feature should be done after 35 hours.

This aggregates higher to the USER MANAGEMENT header as well, showing us the value of 76 as it draws all estimations in it’s sub lists of Dashboard, Interact with Review and Social Media Elementals.

Customising the Aggregation Options.

On both Estimation and Budget, you can rename the labels of these fields and assign units.

If you decide to do this after the fact, worry not, you can assign the field settings to a single card, or all cards on the map when editing the options.

The list of options available when customising your fields.

To edit, open up a card and click the grey cog wheel next to the Estimation or Budget field.

Here you can rename the fields, and assign units.

Units available are:

  • none (default)
  • points (pts)
  • EUR (€)
  • USD ($)
  • weeks (w)
  • days (d)
  • hours (h)
I settled on Estimation and used the units as “hours”.

Apply to all cards please, and let my map be beautifully informative.

Vertical or Horizontal

Aggregation can be applied horizontally or vertically.

When you apply it to the Group and List Headers (Vertically) the aggregation will be drawn from the entire column, spanning every sprint or value.

As such, it is much more common to see the aggregation applied horizontally to see the Sprint status.

Aggregate up or across. Dynamically see your sprints and tasks.

Aggregation Helps

A user story map need not be static. Teams can update it with findings from research spikes, revised estimations, and user feedback from sprints and releases. The story map can also be used as a visual roadmap to communicate both the planned work and the work that remains.

So if you find yourself as a product owner or project manager wondering the status of your developers, and you want to avoid it interrupting them distracting them or holding unnecessary meetings, the aggregation tool is invaluable for your management.

It allows your developers to keep you updated while allowing an optimal level of communication. Maybe they’ll get more done? 😀

Give aggregation a go, you’ll be surprised how much control it gives to your map. You can access aggregation options with a Premium Subscription, or with the free sign-up trial.

Happy Mapping!

Product Owner Skills: What Do We Need?

It is essential that Product Owners in 2021 have a wide variety of skills. Soft skills (skills that are hard to measure) and hard skills (easily defined and specific skills).

Soft skills (such as communication, leadership, and creativity) and hard skills (like sales, data handling, and proficiency with development tools) both help create the best Product Owner. Gaining experience and knowledge in both skills is challenging and rewarding, but the soft skills are naturally harder to define and therefore harder to measure improvement.

Product Owners Boost your soft skills and enhance your collaboration, leadership and creativity with FeatureMap.

The role of a Product Owner is to lead, defines the work flow of the project, organize and prioritize the backlog of the team and streamline the project while maintaining the conceptual and technical integrity of the product. Heaps of hard skills, glued together with that all important management of individuals via soft skills.

A product owner can however help themselves with the use of Tools which complement and enhance those soft skills. User Story Mapping, and the use of creating a map and running a mapping session with the entire team, can really help boost and compliment your backlog management or project planning.

In LinkedIn’s ‘The Most In-Demand Hard and Soft Skills of 2020’, the top three soft skills are creativity, persuasion and collaboration. Three top skills that are required in Product Owners and Project Management.

With User Story Mapping and FeatureMap, you can give your creativity a boost as you create a map with ease, layout your product in easy organized cards, columns and utilizing the basic Agile design. Linking in immediately you can super up your collaboration as you bring your team members onto the board, and your entire broader team can fill in their own user story journeys, discussing and building a map together.

Seeing the bigger, larger, broader view of a project gives your decision-making and leadership a boost.

With the broader view, and bigger picture, you can give your persuasion and leadership that supported weight and sell your decisions to your team and stakeholders.

As a Digital Product Owner, you are at the helm of the product.

You will be the one responsible for ensuring the product is on track, and the product vision has been achieved.

You will be responsible for influencing cross-functional teams.

Why not give yourself a secret weapon?

Story Mapping: A Reliable Agile Methodolgy

User Story Mapping - A Reliable Agile Methodology

Story Mapping consists of ordering a project or product into tasks and organising each one into segments so you can better understand the whole picture and make better informed decisions for timelines, resources and roadmaps.

Such tools as Trello can be great for tasks or quick lists, but when you need more than a just columns. User Story Mapping utilises an agile methodolgy, incorporates sprints and gives you a broader view across the entire project.

When it comes to backlogs it can feel overwhelming, in some cases difficult to grasp how to start or what to prioritise. At times projects can be entirely sidetracked by mismanagement of priorities and a good Story Map of a product can highlight the Minimum Viable Project.

To solve these situations a Story Map can be utilised to reduce the backlog, refocus the project and remind the entire team of the end goal.

When designing a Story Map you must look at the bigger picture. It is often sensible to set aside a period of time (hours or days) to effectively cover the vision. We have some further in depth guides and resources to read up which are linked again at the bottom of this article. But for now.. we’ll cover the basics as an intro to why Story Mapping is a reliable Agile Tool.

We have guides all across this blog, but to get you straight into it, lets do a quick theory crafting test.

You will need to set out the broad goals of the entire product… the ideals, the dreams, think big.

To best utilise Story Mapping is to tackle the entire big picture, not just a singular sprint. Do not fall into the trap of a niche narrow sprint at this stage. The power of User Story Mapping is being able to see the entire product and split it up into those sprints. To see what can the MVP, what can be the optimal, and even split the big picture into easy acessible projects.

First write out the user stories by setting out functions.

The fuctions could be “Logging in” or “Website Dev” or “Graphics Design”.

The limit is based on how you wish to organise. We suggest basic, and start simple as the beauty of working on a tool with many is the ability to adjust and change at will.

Good rules to follow:
Horizontally, set out the title and set the user story under each function.
Vertically, set out the main stories or issues related to each other.

At this stage you can then prioritise importance from left to right, and from up to down. This creates a format of the top left card, being the most important.

Once you have the information down in cads and across the board. Start to slice.

Slicing the list.

Once the stories are organised into groups and themes. You can start with slicing the list into sprints of what is the Minimum Viable Spec, or as Jeff Patton puts it — “The minimium viable product in the smallest product releases that successfully achieves its desired outcomes”.

Step 2 — You can see the sprints have seperated, clearly, what functions are required in each layer.

You can set sprints into what you need to achieve. The trick of utilising story mapping is by setting out the entire dream product, then breaking your product/project into sections of achievable, working, and required sprints.

Wait… are we done already?

Do remember, the story map is not a static beast, it can be adjusted, amended with feedback, changed and adapted to suit the needs.

With multiple team members working on it, as a team, you can start to see the end goal, the ideal product. When working as a group you will be able to clearly define what each of you need.

Too often I have seen teams all have an idea in their head, start with a map and quickly realise their shared vision was mismatched!

The simple act of making the map together re-aligned with everyone on the same page, generated new innovations and removed any potential future unnecessary friction.

Next Steps.

Some more tips for the next steps:

  • Set status of a card
  • You can set time estimations
  • Set importance of cards
  • Use colours to set a custom identifier, such as challenge or complexity.
  • Use extra columns and set sections

The use of a story map will grow with each iteration, and with each demand.

Step 3 — Expanded map with colours, descriptions, checklists, status, and time estimations.

One thing is to ensure you are always planning the entire project, clearing backlog and not focusing on individual sprints.

And all of a sudden you have a grasp of your project.

It really is that simple.

If you want to see the tool we used for the images, check out FeatureMap.co

How to create a user story map in 7 steps

User story mapping is an agile methodology with a focus on product design/development. It doesn’t stop there, but in this article we’ll focus on product design. Designing with user story mapping is one of the secret weapons to create a user-centered product. The product design process always begins with first understanding the problem and the user’s goals. The power of this, is the ability to spec out multiple users, mulitple goals and clearly display our entire process whilst following a natural, narrative flow of the users journey.

User Story Mapping can be narrowed down to organising user goals, activities, and user stories. This can help your product flow or backlog and create an visual backlog, that everyone understands.

Why is it important to create a User Story Map for your project?

  • Your customers need a simple way to confirm product goals.
  • Your teammates benefit from such a straightforward platform.
  • Teammates can get access to the entire scope and see and add valuable ideas.
  • Developers can see the entire specification for the product.

To sum up, user story maps are the visual aid to building shared understanding between project members.

Creating a user story map can take time, but you can follow a pretty clear and logical process, with a good efficient start you’ll be ahead in no-time. This could be a solo task, but to the absolute advantage of a user story map is to use it as a tool to have discussions with your wider team team.


What you’ll need: Grab your team, your VOIP of choice, boot up a brand new Map (Create from scratch) and sit back with a meeting blocked out for the team.

Do note, this is not a presentation but an involved group activity, so be mindful of voip etiquette.


Step 1: Frame the journey

Before you start mapping, you want to frame the exercise around a common goal. This could be your product vision or the goal of a specific feature you’re mapping out.

One of the simplest ways to do this is just to ask: What does our product do?

If this feels too big or gets too unwieldy, think about some constraints you can add to your user story mapping session:

  • What? – What problem are you trying to solve? What product do you want to build or what feature do you want to add?
  • Who? – Is there a specific user or user group you’re building for? Who are your potential customers?
  • Why? – Why build this for the user? What is the benefit to your team and company for building this feature or product? How will giving users this add value to the bottom line?

Talk it through and make sure everyone understands the vision and overarching goal of the user story mapping session.

Be aware, you may find such varied views from each other this may outline some sticking points from the get go!


Step 2: Build your story backbone

The backone of your map covers the entire journey described in high-level tasks or steps from start to finish. Don’t get too detailed, that comes at a later task. Go wide, not tall. Discover your goals and map your journey.

As an example, let’s say we’re building a product that helps someone buy a record track. At the highest level, the steps they take are:

  1. Sign up for an account
  2. Search for the track by genre/year/artists/album
  3. View/listen to the song track
  4. Enter payment information
  5. Buy track
  6. Download track
  7. Interact with social/stars/review of track.

Each feature or step can get more indepth later and expand out with sub headings, cards and individual descriptions.

Your product is probably a lot more complex. Here are few ways to help identify your backbone:

  • The expert details the journey: Ask one of the subject matter experts to walk through the problem step-by-step. How do they tackle this? What steps do they take and what tasks do they perform?
  • Everyone creates cards and inputs on the map: As you create cards on FeatureMap, get each familiar team member writing their own cards and detailing their journeys. Everyone can input the steps that need to be taken and add them to the map. Don’t worry about duplicates now, as this may highlight misunderstandings or merge tasks to a better project flow.
  • Brainstorm with your team to collect the most possible solutions and put all user stories under the related steps.

Once complete, think about the ideal user flow. The use case. Does the map fit and cover all steps for the journey?

What if you’re working with an existing backlog? If you have a backlog full of well-written user stories you can simply add them into your map. In some cases, this might even be the majority of your steps and you could utilise an API, or import features from JIRA or Trello.


Step 3: Identify and group your cards

As you look through the steps your user takes, you’ll start to notice some common groups, or activities that could be placed within groupings. In user story mapping, we call these activities.

Your activities (also known as user stories at this stage) are listed above the user steps (or epics) to make up your backbone.

As an example, lets return to our previous product of buying a record track. Here we can build out a step:

  • Search for a track by genre/year/artists/album

We can break this into individual cards of:

  • Search for a track
  • Search for an artist
  • Search for an album
  • Search within a genre
  • Search for a genre
  • Search tracks within a year, or a specific year.

You can see how these could all be individual tasks with a group of “Search for a track”. Here we can, with relative ease, start to identify user steps, user stories that all correlate to a user goal.

User Goal/Activity – Find a Track.
User Step/Epic – Search
User Story/Card – Search for an artist, then search for a track.


Step 4: Break large tasks into subtasks

It’s time to go a step deeper. The cards in your backbone are most likely too big to be tackled in a realistic single sprint. This step covers breaking down those cards and activities into smaller groupings and user stories.

Step 4 involves your team editing cards, splitting them into two, rewriting and reorganising them. Cards here could be reorganised and moved around the map. Placing cards into activities/sections/groupings will making it clearer for all involved promoting that shared understanding.

One key point of advice – Do Not Get Bogged Down!

FeatureMaps and User Story Maps are living, breathing things, cards get developed, edited, added to and when first mapping out the entire user story aim to cover it all at a higher level scope first.

Step 5: Fill in missing tasks.

This step has you expanding, checking for missing task, filling in the blanks.

Ask your teams if they are covered and user story is represented no the map.

One simple and effective test is to have someone walk through the scenario from a different user perspective. This is what is called utilising Personas. Act out the steps as your user and allow the team to highlight when missing steps/cards/goals are not on the map and have them add them.

Each department will see this differently, for example the graphics and UX design team may differ on presentation while the coders are thinking about stacks and the sales team are thinking about pain points and upselling.

If a team member states “Ah ha, this is missing or may cause problems…” then this stage is doing well.

Step 6: Prioritise your activities and cards.

Your Map and backbone is how your users move through your product. Each section at this high level are equally important, building blocks to the entire product/project.

Here you can easily see the whole picture and work with your team to find the best minimal viable product. This stage is ideal to figure out what has the highest priority, while allowing other sections to be put aside.. for now.

Now that you have the user map prioritised vertically, you can create horizontal “layers” that represent your MVP to Full release.

A good practice is to ensure that each layer should be creating value across each user and activity.

Step 7: Maintain your Map.

The last step covers using your living, breathing, evolving map.

Checking up your progress, see quickly the wider picture of your team.

Ensuring cards and tasks stay on track, assign deadlines to individual tasks and adjust work flow carefully.

In FeatureMap you can assign dates to tasks, cards or groups to keep track of progress.

You can assign cards to individual team members, and add progress status to each card, such as “todo, progress, done, etc”

You can expand and add timings or costings, or other custom metrics and utilise the aggregation tool which allows you to see the combined time within each sprint, grouping, or the larger map.

Audio Finder – A Fictitious Project about finding audio tracks and downloading them. Viewed as a User Story Mapping Board on FeatureMap.co

You can view the example map here, where we have enabled public sharing to allow anyone outside the team to view: https://www.featuremap.co/mp/aRV8c0/audio-finder-project

Maintaining a User Story Map will allow you to continue with an organised approach, power up your management and team communication.

If you want to see more guides, check out some other blog posts, or if you want to see another example – check out Movie Buddy Map.

Get started now for free right here.

Story Mapping Can Help Your Team Understand – Remote Offices in 2021

Shared Understanding - A buzzword to describe group knowledge

When working with a large organisation it is not uncommon for everyone to picture the product from different angles, resulting in an understanding of the project or product in different ways. Story Mapping can help your team understand, bring those meetings to the digital and allow your remote working team to gain that shared understanding.

When you have multiple smaller teams come together to create a product, each team can have different requirements. This can clog up development and in some instances waste time, building the same features or two different features due to a bad understanding of the spec. These teams could be in the same office, or spread across the world. The challenge and solution is the same.

A few years ago I was assisting in the development of a now-popular mobile app. The team of designers all had different ideas on the end goal and it wasn’t until we mapped the entire user story that this was realised.

Confused Team Mapping Out Individual Requirements

The managers wanted to see a CRM in the backend that would allow them to see the flow of products and users and to manage the support workers and content creators.

The content creators wanted to have a CRM in the backend that allowed them to edit, create and update articles and products.

The sales team wanted to have a map system that would allow users to find a product based on location.

Shared Understanding with a Shared Vision

When we put all three together we could see an conflict of understanding. Two different CRM systems and a product completely overlooked by the other teams, with overlapping cards.

Without using a FeatureMap Board, this error may have gone unnoticed for an unspecified amount of time.

Cut down your time and mismanagement, introduce a macro level understanding and make your job easier managing your team. If you are a team member, you can understand the entire project/product and figure exactly how best to utilise all talents and input.

Mapping your story helps you find holes in your thinking.

When we set out and built an entire map, it was clear that each team had a different idea. Once they were able to list each card across the map, teams merged ideas, worked on the initial idea and framed the entire product.

Once the ideas had been merged, expanded and realised, the team was able to expand their understanding to a shared understanding.

Shared MVP Achieved With Understanding

The team were then able to split up their design into a minimum viable product that successfully achieved the desired outcome.

Sadly, it was realised that months had been wasted on planning features of a project with no compatiblity with the rest of the team.

Fortunately, when creating their product on FeatureMap (even linking with remote team members across the world) they were able to hash out a new plan and deliever well within time.

Mapping your story helps with shared understanding.

When starting with FeatureMap, it doesn’t matter if you are mid project, or at the start of a new journey.

Mapping out the entire product, even at a high level macro level will help your entire team progress forward.

You can start with FeatureMap today for free, with an instant 2 week trial to access all the extra features such as aggregation, import, export, enhanced status cards and alike.

Scrumban, Kanban, Scrum, Agile, You can do it all.

Over the last 10 years (probably more) the boom of Agile methodology has continued to rise with the need to harness a high performing, high impacting workforce. Project nanagers, teams and companies have adapted its methodologies and the search and battle of Scrum Vs Kanban has become a well known and familiar comparison.

Scrum, and Kanban are two methodologies that come under the wide umbrella of Agile Methodology, both have benefits and drawbacks, but combining the pair has led to some success but still retains its overall pitfalls. Over the last year the move to remote working has become a necessity for many work forces.

Scrumban involves applying Kanban principles to a team’s Scrum framework. Scrumban removes some of the more rigid aspects of Scrum and leaves teams to develop their own adaptation which can give a huge varied experience.

So what do the two methodology bring?

Scrum

  • Fixed requirement.
  • Improves team involvement.
  • Allows to track project workflow.
  • Repeated work cycles.
  • Deadline.

Scrum is an Agile framework that is designed to focus on maximizing the team’s ability to deliver quickly, to respond to emerging requirements. Common practice is to explore and set a fixed requirement to tie in with the fixed deadline. The Scrum process requires the use of fixed-length development cycles called sprints, which usually last between 1-4 weeks.

Scrum came about in the late 1980s, as a commercial product, self described as “a new approach to commercial product development to increase speed and flexibility”.

Scrum teams are designed to be small, cross-functional, and self-organizing. Teams split work into small, shippable product increments, and sort the work by priority and relative effort. The product owner selects all work to be done in a sprint at one time, then the team spends each sprint completing the work.

How a typical Scrum board looks in FeatureMap.co

Scrum Board at FeatureMap
Using the basic features of FeatureMap as a Scrum Sprint Board.

Kanban

  • No overproduction of tasks.
  • Flexibility.
  • Limit Work in Progress (eliminate waste and people focus).

Kanban was introduced by Toyota in the 1940s, and was largely used in the manufacturing world as a visual workflow management methodology. Work items are represented by cards on a board, with rows that represent process steps. Boards are used by teams to manage the collective work of the team. They minimize chaos and promote focus by explicitly limiting how many items are in process at any given time, using a tool called WIP (work-in-process) limits.

Teams practicing Kanban measure lead time (average time from when work is requested to when it is finished) and optimize their processes to improve lead time, with the goal of achieving a continuous, predictable flow of value to their customers.

The downside of Kanban is how it is based around manufacturing, and as such has strict and inflexible method of change as it assumes a stable product flow.

How a board of Kanban looks in FeatureMap.co

Using the basic features of FeatureMap as a Kanban Production Board.

So why would you be interested in Scrumban?

Scrum + Kanban

Scrumban combines the structure of Scrum with the flow-based methods of Kanban. So what of Scrum is incorporated into the Scrumban method:

  • Iteration planning at regular intervals.
  • Decide work load in each sprint based on the complexity of the work and the length of the sprint
  • Extended Board
  • Prioritization on demand
  • Use “Next/Ready” column to help organise.
  • A fixed deadline helps identify and focus work flow.

Kanban adds visualization, process, and flow. These are the elements of Kanban that are used by Scrumban teams:

  • Pull items into Doing adapting to the teams capacity
  • Individual roles are flexible.
  • WIP limits: Limits on how many items are in the backlog and progress.
  • Short lead times – just-in-time in stead of batches.
  • Focus more on deadline adaptability to the WIP and MVP.
  • Clearer step transitions

In a Scrumban Board you can see the merger of both Scrum and Kanban headers:

Backlog (Queue)On the Deck (This Spring)Next (Ready)SpecifySpecifiedDoing (Development/Active)Pending Testing (Approval)Testing (QA)DeploymentDone
An example merge of the kanban and scrum headers to make the ideal scrumban.

Scrumban boards are taking the best bits of Kanban and Scrumban, but is this enough?

The FeatureMap solution

A Scrumban board can hit some of your goals, and if you are looking and wanting more, FeatureMap offers a hybrid solution of Kanban, Scrum, and User Story Mapping. The tool can hit all the marks and is entirely flexible. In fact in some scenarios so flexible it can be daunting to the unprepared how best to utilise this powerful tool.

Scrumban is useful when it is difficult to predict the amount of work. It is useful with combining flexibility, adaptability and monitoring tools of Scrum, and a Kanban board.

FeatureMap adds that extra tool, how to map the entire product with your team, online and with tools and access to Kanban, Scrum, Scrumban or your own hybrid method.

You can combine the best of both worlds, with a scrum board and carefully not mixing the cards, but at the same time using layers to retain a sense of roadmap, listing prioirites. An enhanced scrumban board with more dimensions.

Want a card to have tasks? – Done
Want a card to be assigned to an individual to track? – Done
Want to have priorities, colours and custom status tracking on all cards? – Done
Want to assign an entire row, column or grouping to an individual to team? – Done
Want to change the entire map on the fly for a better solution? – Done
Want an aggregation feature to show pricing, timing or estimations on cards below and groupings above? – Done
Integration? On-Premise? REST API? – Done

FeatureMap is not limited to a scrum, or column only approach. It is not limited to a kanban outline. It was originally designed by engineers for their own products. It later took off and became its own self sustaining application based on Jeff Patton’s User Story Mapping methodology. Taking the persona of the target individual, audience, market, requirement and building the demand of a project/map/product around that.

But lets keep to the Scrumban design and restrict ourselves to the standard flow.

FeatureMap utilising the hybrid approach of Scrumban, Kanban and Scrum

On this board we have split the flow of the transition from left to right into 4 main columns.

Within each column:

First the backlog, set tasks that are known or in discussion, set here and at a high level, placed in a loose month set. The queue of tasks to be arranged.

Secondly the Development column is split into 4 different states – blocked, progress, pending and confirmed. These represent the flow of coding, or manufacturing. You can see in these cards two icons of myself, a little face which represents the card being assigned to me, so I receive notifications of comments, checklists, dates and status updates.

Third, the QA section is simply split to “To review” and “Verified”, so tasks can flow from developed, to quality assurance. and ready to be reviewed. In the screenshot above, you can see one card highlighted in yellow. With FeatureMap any card can be highlighted a variety of colours, easy to draw attention or to be set for a predetermined meanings.

Fourth and finally, the last section lists “Delivered” an area for final review from the project lead, to accept and sign off completion.

As well as the main “June” horizontal layer, we can see multiple layers of dates, June, July, and “Later” which can also be adjusted on the fly by various teams to move cards up and down, dynamically with their expected

FeatureMap can be utilised as a tool for more than User Story Mapping. It can be a tool for bringing your project and tool under control, and with an advantage.

FeatureMap offers multiple solutions, but for this case. It’s the perfect Scrumban solution.

The Customer Facing Story Mapping Solution

In 2020, the pandemic forced businesses to adapt and move to to remote solutions, projects had to revisit back logs with adjustments from the physical to the digital.

With that came the need to communicate and work with clients and customers remotely. Luckily User Story Mapping is the perfect method to visually cover the entire scope of the project/product, to help discussions, and gain a shared understanding direclty with your client.

When building your story map, you should include all the relevant people, regardless of position.

Each member invited will offer different foundations and interests, they will all offer unique and valuable points of view. A User Story Map is used to map out what you, as developers or managers think about when it comes to the user’s experience.

Bring in your Client

This advanced tactic is to involve the customer/client with a map designed as a Customer facing Story Map.

Customers have probably seen roadmaps, or gannt charts in the past but to truly involve a customer with your plan of development or project outline is to utilise a Story Map. A Story Map can show your progress with a beautiful planned out snapshot. Allow your client to choose where to zone in and understand.

In the example below,  we took our Moviebuddy map, a fictional product which helps you arrange and organise your DvD collection and had our development team plan out the requirements for each user story. We needed to share with our client what exactly we planned and if our vision was shared.

The Moviebuddy Current Version

A tool such as FeatureMap, used to share your product design lends more value to the customer, as it is always online, available to view and offer feedback.

When should I use a customer facing story map?

When sharing story maps with customers, it is important to iterate that a story map is not a roadmap, it is a living, breathing, evolving workflow. One day you may have features and functions set for the next release and the very next day it could be bumped up, down or adjusted.

The value of such a map is measured not only in the transparency of your dev team and work, but the process of your dev team.

In one such instance, we saw a knowledgeable member of the public witness a planned feature who then recommended an alternative method and offered code, for free. Through sharing your Story Map the project was assisted by a passionate user.

In another instance, a video game developer shared their planned game development, their beta and was able to get thousands of players to see the progress, suggest plans and help develop an ideal release. The access to so many eyes of potential customers, potential users was invaluable for feedback and further development.

Story Mapping evolves and changes. If your customers struggle with the methodology it is probably wise to have two maps, one for devs, and one for the customers. You can set one to private, for your team and shareholders who can work through it and have a public shared customer facing map which encourages feedback, and interaction. We advise experimenting with the entirely public facing single map first.

As such we advise involving a customer as soon as possible.

How to make the map public with FeatureMap?

When on your FeatureMap, click the top right blue spanner icon:

Then below you’ll have your options pop up.

Here you can click “Make map public”.

Do note you can click this button again “Make map private” to remove your public access link.

Make your map public.

Once public you’ll be able to share the URL and add this to your emails, webpage or direct as links.

To see an example demo map check here: https://www.featuremap.co/mp/FviDEf/moviebuddy

You can get started with FeatureMap, and if you need more help or ideas, check out our 5 reasons to use User Story Mapping or a specific idea such as Feature Definition.