High-Level Understanding – Utilising Aggregation in FeatureMap

User Story Mapping and FeatureMap

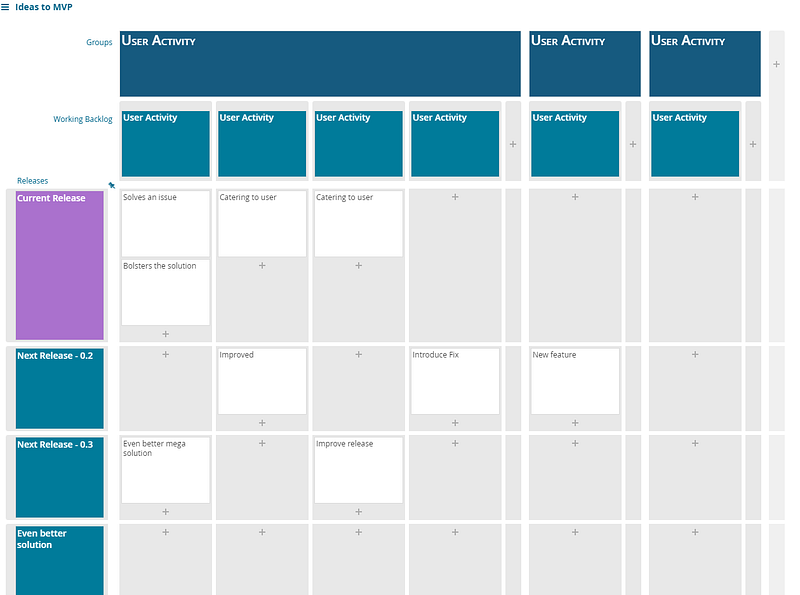
User story mapping can allow your team to see and understand the product from a user-centric design. You can see the bigger picture of the product, help the team identify gaps and dependencies, and give the first framework of a shared understanding between your entire team.

A finished FeatureMap Board should have your entire product outlined. The team will have sections separated, and you’ll be scheduling and planning the outline of prioritized stories into sprints and releases. 

In this article, we will share how to gain a better shared understanding of a map by utilising the feature of aggregation.

In short, it is the option of aggregating values. On each card you can assign a status, estimation and a budget. When you assign the aggregation option to a header card, the card will gather the values of all sub cards and calculate, dynamically, the overall status or number.

e you can see the FeatureMap Board of the Audio Finder Product, fully incorporated with aggregation of both status and time.
Here you can see the FeatureMap Board of the Audio Finder Product, fully incorporated with aggregation of both status and time.

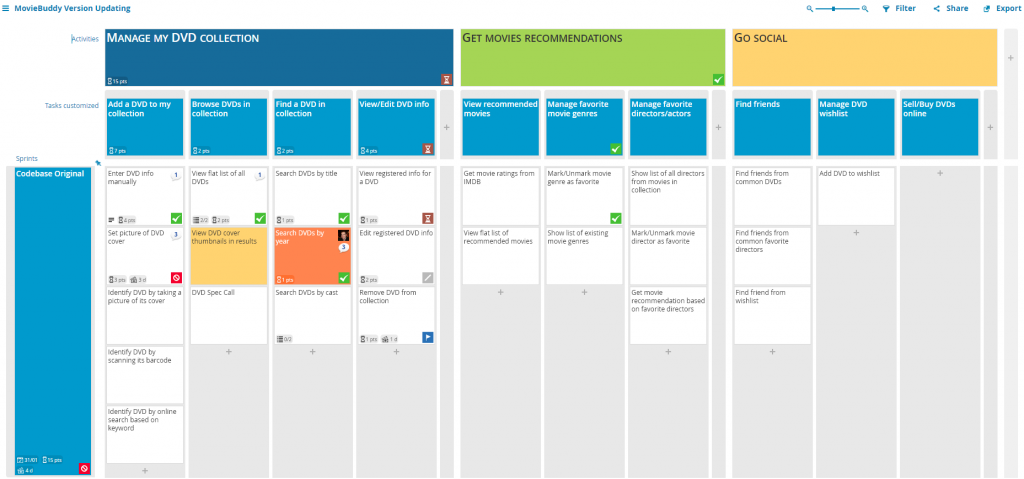
A beautiful map, full of information, which can be daunting, but with ease you can see if the product development has any issues just by looking at the aggregated dynamic values on each of the layer headers.

Let’s break it down.

Status Aggregation

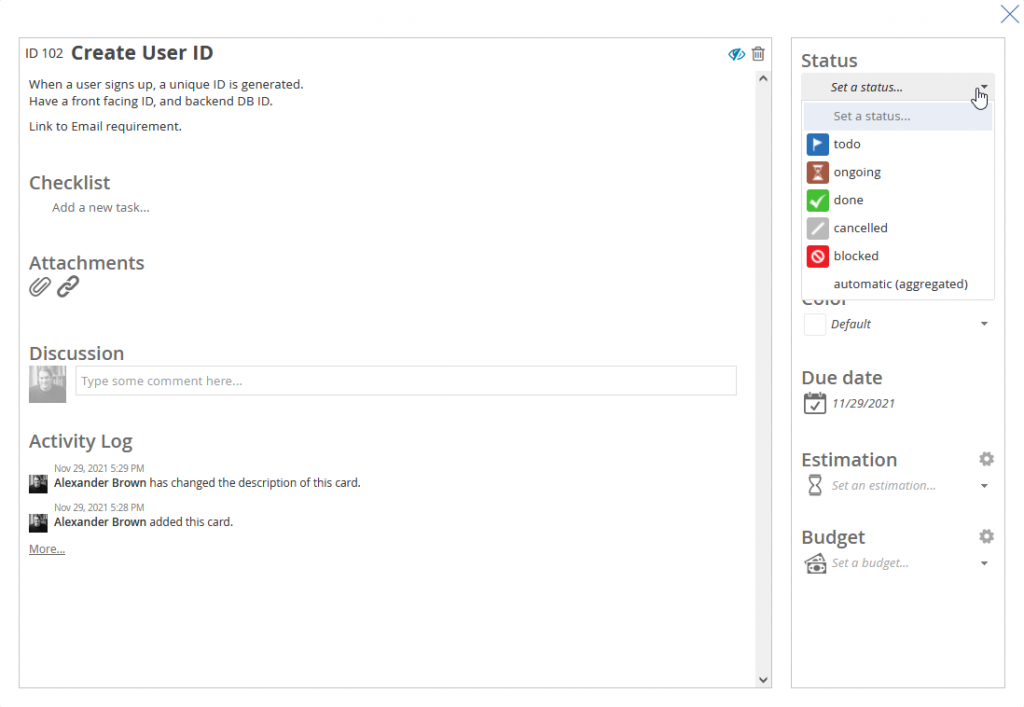
With Status, you are able to assign to a card, displaying a coloured icon on the main map. Great for that easy acquisition when viewing the larger map.

The statuses you can apply are: Todo, Ongoing, Done, Cancelled, Blocked.

With FeatureMap you can set statues to all cards to help with task management.
The Card – Register Online: Applying a status for the state of its task.

With aggregation, you can apply the option “automatic (aggregated)” on your header cards, and the header card will a value by priority to display allowing the team to see each header, and associated higher task status.

A quick glance at a busy map can be even quicker with good application of status icons, and aggregation allowing you to identify issues and solve them quickly. This is one huge advantage for those busy product owners or leads 😇

The priority for aggregation display is by importance: Blocked -> Ongoing -> Done.

When a card is set to “To-Do” and “Ongoing” are is aggregated as “Ongoing”.

  • When a column or layer has a “Blocked” card, this takes priority and is aggregated as “Blocked” as to draw attention to issues.
  • When all cards within a column/layer are done, the aggregated value draws “Done”.
  • The status “Cancelled” is ignored.

You can see Sign Up has been set to Status - automatic (aggregated)
Automatic (aggregated) has been applied to this Sign Up Card (Header).

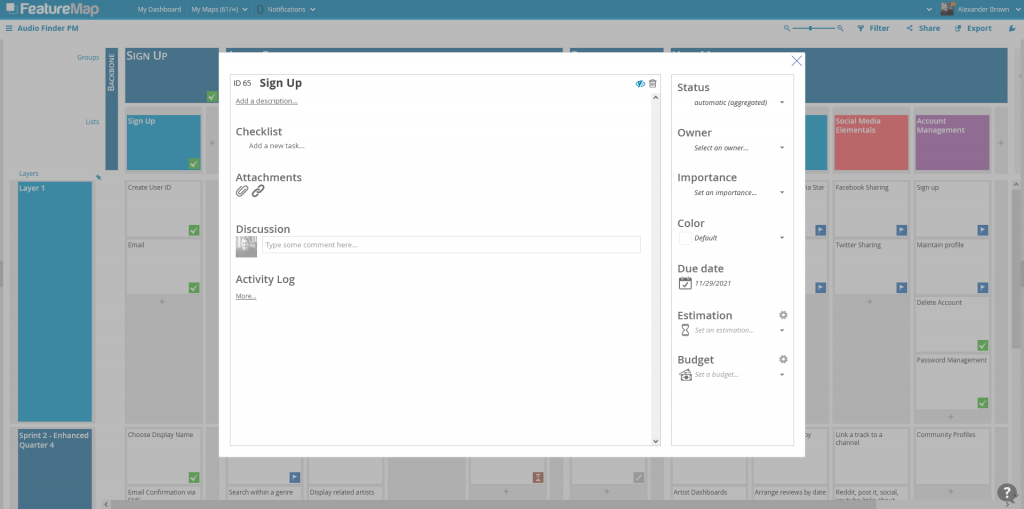
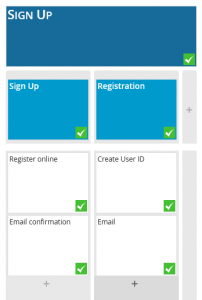
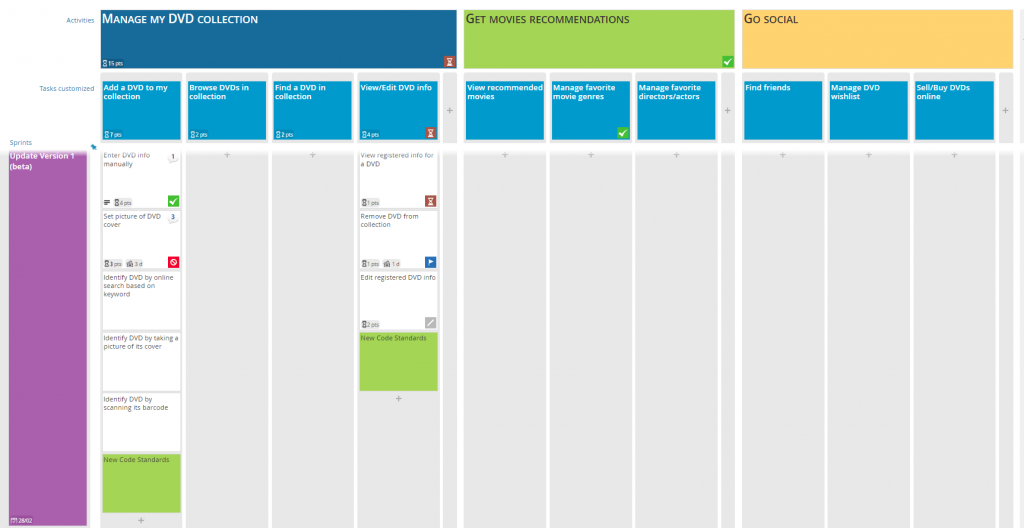
The header card (groups) Sign Up has been set to an automatic (aggregated) value.

The sub headers (lists), Sign Up and Registration are also set to automatic (aggregated).

The cards in those columns have all be seen set with “Done” status.

The value will dynamically be displayed based on the values of the cards within the sub-cards.

In this case, FeatureMap draws the values from Register Online and Email Confirmation.

Both are “Done”, so the value aggregated is “Done.”

Budget and Estimation Aggregation

The task status is not the only aggregation option. You can also track your assigned values of budget and estimation.

When you assign numbers to a card, and then aggregation to the header. It will draw vertically to each header group and list or, if applied to a layer header, it will draw horizontally to each layer. This allows you to see the overall bigger picture, but also a specific collection of times, costs or the main status of the project.

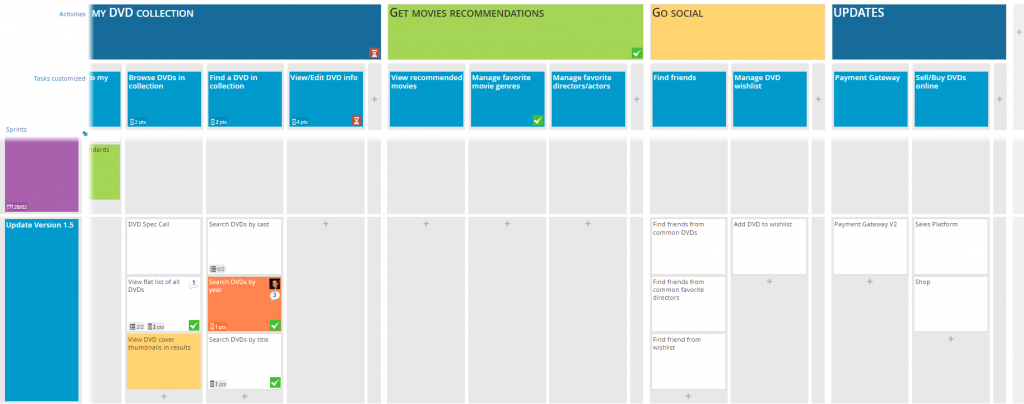
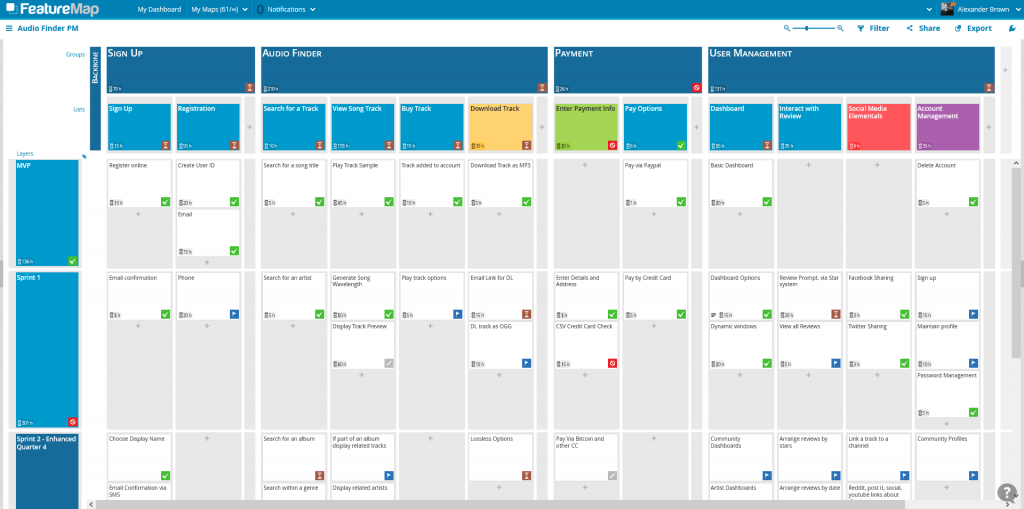
In this FeatureMap we are utilising Aggregation.

On the User Management Section, we are not aggregating status instead we are estimating the time it will take for our developers to code the described section.

You can see the Dashboard Options Card is estimated to take 15 hours, and the Dynamic Windows Card is estimated to take 20 hours.

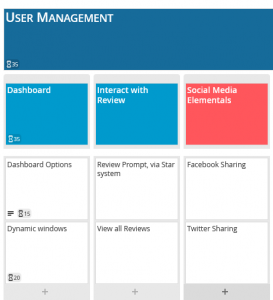
The header above – Dashboard draws those numbers and calculates both, giving us 35 hours. At a quick glance, the team now know the Dashboard feature should be done after 35 hours.

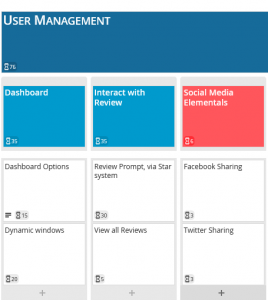
This aggregates higher to the USER MANAGEMENT header as well, showing us the value of 76 as it draws all estimations in it’s sub lists of Dashboard, Interact with Review and Social Media Elementals.

Customising the Aggregation Options.

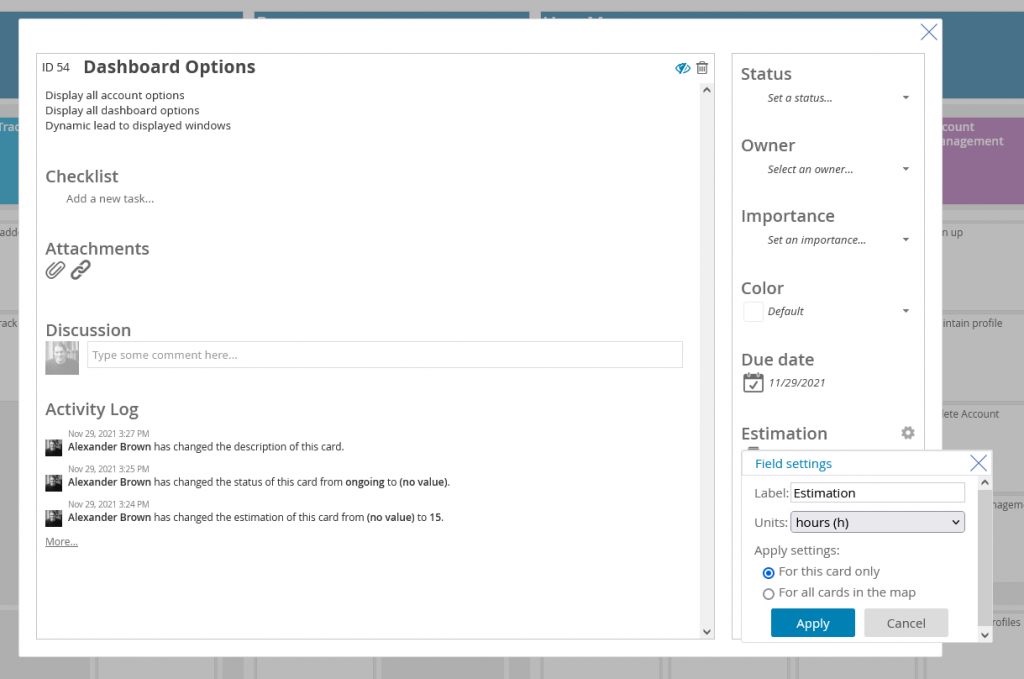
On both Estimation and Budget, you can rename the labels of these fields and assign units.

If you decide to do this after the fact, worry not, you can assign the field settings to a single card, or all cards on the map when editing the options.

The list of options available when customising your fields.

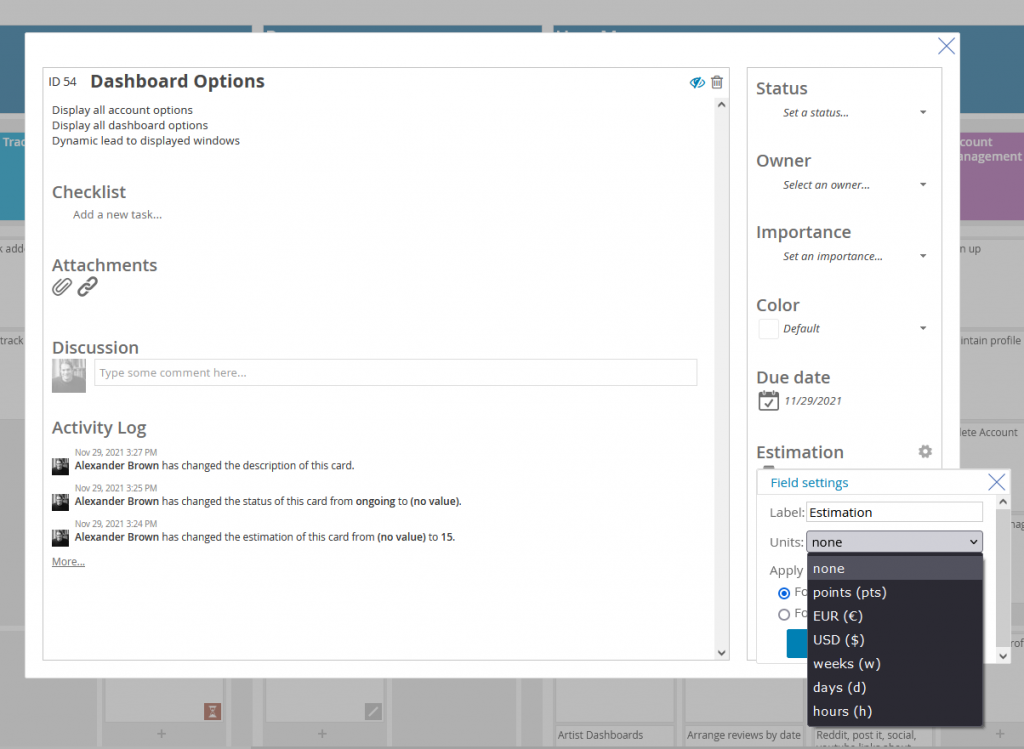
To edit, open up a card and click the grey cog wheel next to the Estimation or Budget field.

Here you can rename the fields, and assign units.

Units available are:

  • none (default)
  • points (pts)
  • EUR (€)
  • USD ($)
  • weeks (w)
  • days (d)
  • hours (h)
I settled on Estimation and used the units as “hours”.

Apply to all cards please, and let my map be beautifully informative.

Vertical or Horizontal

Aggregation can be applied horizontally or vertically.

When you apply it to the Group and List Headers (Vertically) the aggregation will be drawn from the entire column, spanning every sprint or value.

As such, it is much more common to see the aggregation applied horizontally to see the Sprint status.

Aggregate up or across. Dynamically see your sprints and tasks.

Aggregation Helps

A user story map need not be static. Teams can update it with findings from research spikes, revised estimations, and user feedback from sprints and releases. The story map can also be used as a visual roadmap to communicate both the planned work and the work that remains.

So if you find yourself as a product owner or project manager wondering the status of your developers, and you want to avoid it interrupting them distracting them or holding unnecessary meetings, the aggregation tool is invaluable for your management.

It allows your developers to keep you updated while allowing an optimal level of communication. Maybe they’ll get more done? 😀

Give aggregation a go, you’ll be surprised how much control it gives to your map. You can access aggregation options with a Premium Subscription, or with the free sign-up trial.

Happy Mapping!

From Idea to MVP

User Story Mapping - From Idea to MVP

User Story Mapping is the perfect tool for taking an idea of a group, and refining it with shared understanding into a perfect MVP.

If you are just starting or have a project that is stagnant or facing a barrier, read on how to easily figure out if you have a product already, or how to best start the planning process in 2021.

When we look at User Story Mapping, you may think of the backlog of user stories, or how it can be a great methodolgy to reduce and refine your current project or product flow. But User Story Mapping doesn’t just need to be a tool applied to a backlog heavy project. It can be used to refine an idea to a product.

Refine the Idea

To start, you’ll be going on a User Story Mapping journey. Take your product and start writing out all the steps out, be as broad as you want.

Take the product and ask yourself and your team these questions:

  1. What is the overall idea?
  2. Who are the customers?
  3. Who are the end users?
  4. Why would they want it?
  5. Why are we building it?

Find out what the project and product is for, validate your reasoning, search for problems, take the steps to refine your idea.

Build to Learn

With the initial idea fleshed out, build your product with the aim to learn. A less than MVP (Minimum Viable Product), a product that covers the simple basis for your users.

With this stage you do not want to market, push or give out the product as “The product” but instead share with a small group of users. Ideally users you spoke to initally that may have sparked the idea of the product or are in your alpha/beta group and open to seeing the progression.

As part of this step you need to harvest the feedback, and constantly refine your idea. Build wants but be care ful to actually listen to what the user wants.

At this stage metrics will help as it is common people will fall into a loose three categories:

  1. The Polite Enabler. — The user who says everything is great, but doesnt use the product.
  2. The Complainer. — The user who sends in lists of feedback and demands, but actually uses the product.
  3. The Mute. — The user who uses the product and says nothing.

The polite user is probably the worst for building to learn, with the complainer being your favourite user. However be careful the complainer is not just demanding features that detract or do nothing.

The Mute you’ll need to reach out, engage and ask for feedback with offered incentives. The mute can be valuable if you can change them from mute to talking.

If you are reading this to get started, you can get started straight away for free. You get given a premium trial for 2 weeks when you sign up, but even if you revert to a starter account you’ll still have access to edit, move and make your map.

You can get signed up, but if you are planning, read on for now.

Applying it all to a Story Mapped Backlog

You now have your project released, some feedback and ideas of how to take it from big idea to big success.

For a practical start, we recommend organising a horizontal strip of User Actitives. You will have this from the first step, and the questions. This will form the backbone and be the foundation of your map.

You can lay it out how you like, but if you want guidance you can lay it out in vertical strips, and arrange it into three tiers:

  • Current Relase
  • Next Release(s)
  • Future Ideas

Each card will have indepth details about the feature.

Example Layout in FeatureMap.co

Then when organised, take the highest priority stories or layers and move into the current sprint.

This is one great way to refine your Idea down to a core set of principles. You can find out your MVP.

When I created my app, I went beyond the MVP and made the pre-MVP core functions. This allowed me to generate an ugly, functional core system to then expand on. I never released the pre-MVP but it helped me define the principles of our app.

Common Pitfalls

I might write a piece entirely about the pitfalls I see new projects and products fall to when designing their story map and MVP but for now, the key two points echoed everywhere:

  1. Perfection — When designing a product do not focus and lose yourself to the “Just one more feature” which adds time and bloat to inital ideas.
  2. Make a skateboard first — When making a car, first design a skateboard that allows the user to at least get somewhere. Do not fall into the trap of building car parts with no method to go.

To illustrate this Henrik Kniberg wrote an article talking about how he prefers “Earliest Testable/Usable/Lovable” over MVP.

Henrik Kniberg

I was once hired to salvage a project. When I started digging into the functions and principles I found that they had been in a state of “not yet ready” and “coming soon” for over a year. I learnt that each time they had developed a section the designers, artists, and owners all had differening ideas of what they all wanted.

I first sat them down with a task of shared understanding, figuring out exactly what everyones vision was, and how it translated to actionable steps.

Then secondly I highlighted they already had a MVP, and had an MVP since the year prior. We seperated the whole system into stages (the horizontal sprints) and were able to wrap up and release the project.

If translated that to Henriks image above, I realised they were at stage 3, while they were aiming to develop to stage 5. Stage 5 before they had even earnt a penny.

Do not do it.

Summary – Validate your MVP

So to summarise.

When designing your product, each sprint sent to product should be reviewed, measured and with feedback and data. To learn.

With that learn knowledge, collect data, read feedback, refine your idea.

If it ever seems out of kilter with the rest of your team, you shouldn’t worry as you are all working on a Story Map, you will all see the steps and sprints. That shared understanding of the project elimates the issues.

With that refined idea, revamp your MVP and build.

  • Build — MVP
  • Measure — Get feedback and data
  • Refine — Improve with better ideas
  • Repeat — Back to Build.

With User Story Mapping this is easy, especially when using a tool like FeatureMap.co as the ease and flow of a team all working, moving and adjusting cards on the fly makes it invaluable.

Get started today, and get your project working. You may already have an MVP!

How to re-write your Legacy Application using Story Mapping

People often mistake User Story Mapping as a tool to start projects, but it is entirely suitable for building up an old project or design.

When looking at your application it is easy to first create  User Story Map based on the products functions.

Establish the tasks, the goals and flesh out the map. Sometimes you may taken things for granted and forget certain tools of the application are actually tasks so it’s a good idea to bring in people from other teams to help identify all the functions of your project.

Build the map, identifiying all the functions.

We once took an old tool and needed to update the codebase, as well as introduce new features and improvements.

A few options may be available to you, depending on the code. Are you able to update the tool in sections? Are you able to approach the update in sprints/versions? Do you need to rebuild the entire program from scratch?

We first built the map of our tool, you can see below our “Moviebuddy” example.

The Moviebuddy Current Version

We then worked through identifying which sections were redundant. We identified these and added them to a new column to the side. Essentially removing them from view.

We then talked out and identified which parts of the code would be updated and what we could do first. We labelled this as version 1 and aimed to get the core functions updated.

Identifying what we should upgrade first in Version 1

We were able to identify one function which we were able to upgrade. We also added new cards which reminded us to update our code standards and highlighted them green to ensure they were completed.

We then moved along to the next version which allowed us to introduce our new payment gateway to the application. A function that had alluded us due to the old codebase.

Adding a new Codebase column and moving to version 1.5

This allowed us to deploy more frequently and provide value sooner as we updated sections of the site. We still had a lot of ‘old legacy code’ but as we added new features we moved the legacy code functions inline with our updates.

As you can see using User Story Mapping can be brand new projects, or old existing projects.

Moviebuddy is all fictional for the purpose of training.


User Story Mapping : From Idea to MVP

When we look at User Story Mapping, you may think of the backlog of user stories, or how it can be a great methodolgy to reduce and refine your current project or product flow. But User Story Mapping doesn’t just need to be a tool applied to a backlog heavy project. It can be used to refine an idea to a product.

Refine the Idea

Take the product and ask yourself and your team these questions:

  1. What is the overall idea?
  2. Who are the customers?
  3. Who are the end users?
  4. Why would they want it?
  5. Why are we building it?

Find out what the project and product is for, validate your reasoning, search for problems, take the steps now to refine your idea.

Build to Learn

With the initial idea fleshed out, first build your product with the aim to learn. A less than MVP (Minimum Viable Product), a product that covers the simple basis for your users.

With this stage you do not want to market, push or give out the product as “The product” but to a small group of users. Ideally users you spoke to initally that may have sparked the idea of the product.

As part of this step you need to harvest the feedback, and constantly refine your idea. Build wants but be care ful to actually listen to what the user wants.

At this stage metrics will help as it is common people will fall into a loose three categories:

  1. The Polite Enabler. — The user who says everything is great, but doesnt use the product.
  2. The Complainer. — The user who sends in lists of feedback and demands, but actually uses the product.
  3. The Mute. — The user who uses the product and says nothing.

The polite user is probably the worst for building to learn, with the complainer being your favourite user. However be careful the complainer is not just demanding features that detract or do nothing.

The Mute you’ll need to reach out, engage and ask for feedback with offered incentives. The mute can be valuable.

Applying to Story Mapped Backlog

You now have your project released, some feedback and ideas of how to take it from big idea to big success.

We recommend organising a horizontal strip of User Actitives. You will have this from the first step, and the questions. This will form the backbone and be the foundation of your map.

Below in vertical strips arrange into three tiers:

  • Current Relase
  • Next Release(s)
  • Future Ideas

Each card will have indepth details about the feature.

Example Layout in FeatureMap.co

Then when organised, take the highest priority stories or layers and move into the current sprint.

This is one great way to take Idea to MVP.

Common Pitfalls

I might write a piece entirely about the pitfalls I see new projects and products fall to when designing their story map and MVP.

  1. Perfection — When designing a product do not focus and lose yourself to the “Just one more feature” which adds time and bloat to inital ideas.
  2. Make a skateboard first — When making a car, first design a skateboard that allows the user to at least get somewhere. Do not fall into the trap of building car parts with no method to go.

To illustrate this Henrik Kniberg wrote an article talking about how he prefers “Earliest Testable/Usable/Lovable” over MVP.

Validate your MVP

When designing your product, each sprint sent to product should be reviewed, measured and with feedback and data — learn.

With that learn knowledge refine your idea.

With that refined idea, revamp your MVP and build.

  • Build — MVP
  • Measure — Get feedback and data
  • Refine — Improve with better ideas
  • Repeat — Back to Build.

With User Story Mapping this is easy, especially when using a tool like FeatureMap.co as the ease and flow of a team all working, moving and adjusting cards on the fly makes it invaluable.