FeatureMap Aggregation – A premium feature for visualisation

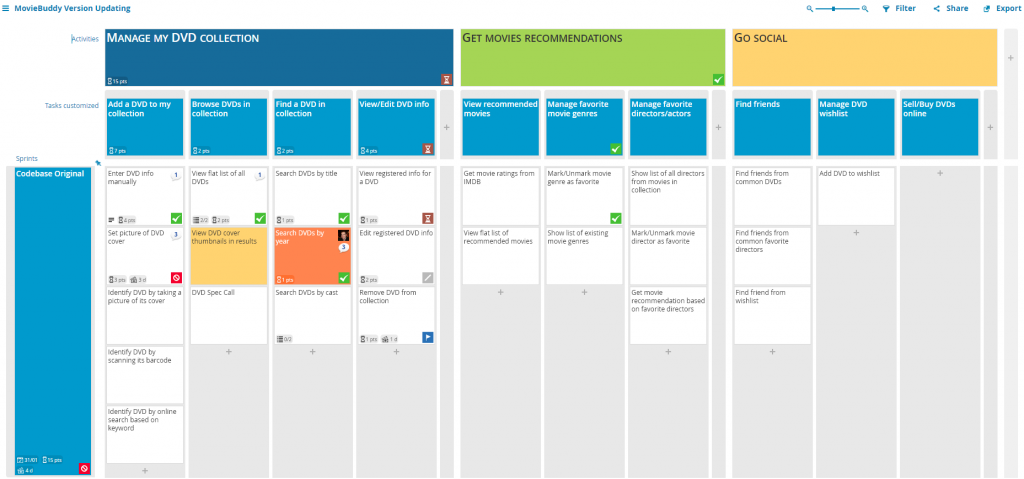
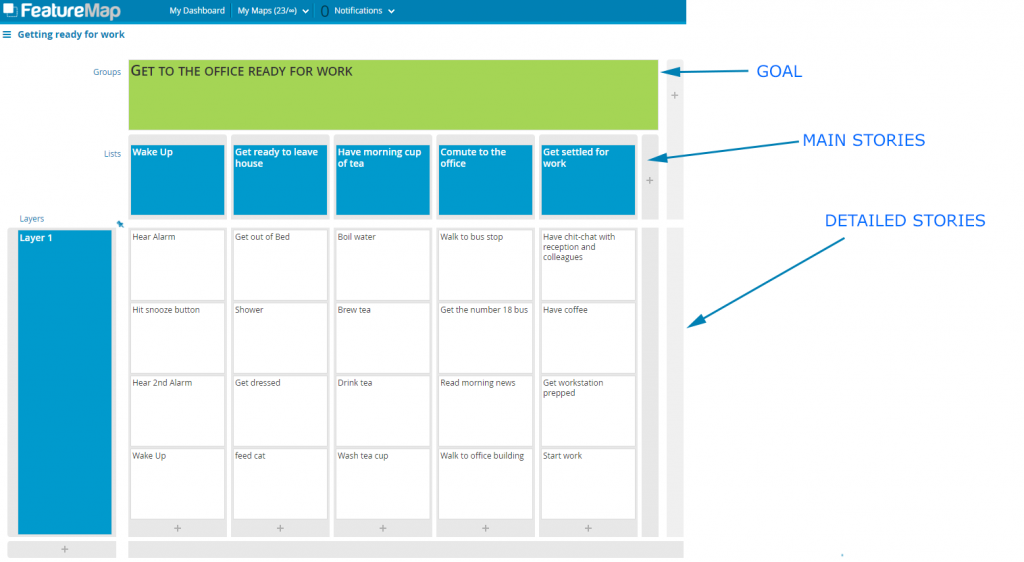
User Story Mapping boasts quick visual understanding at a glance. See cards, layers, groups, headers and quickly determine the map state.

FeatureMap can utilise coloured cards, multiple layers, importance settings and assignment to users.

One of the FeatureMap premium features is the aggregation of values.

Moviebuddy is our go to demo map and let’s jump straight into it.

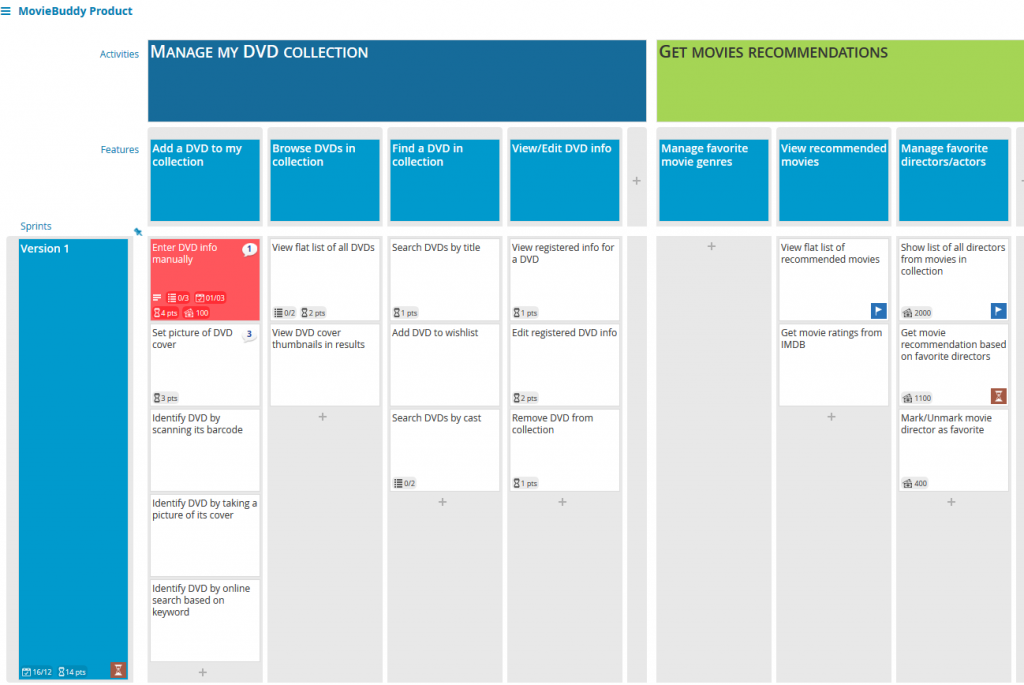
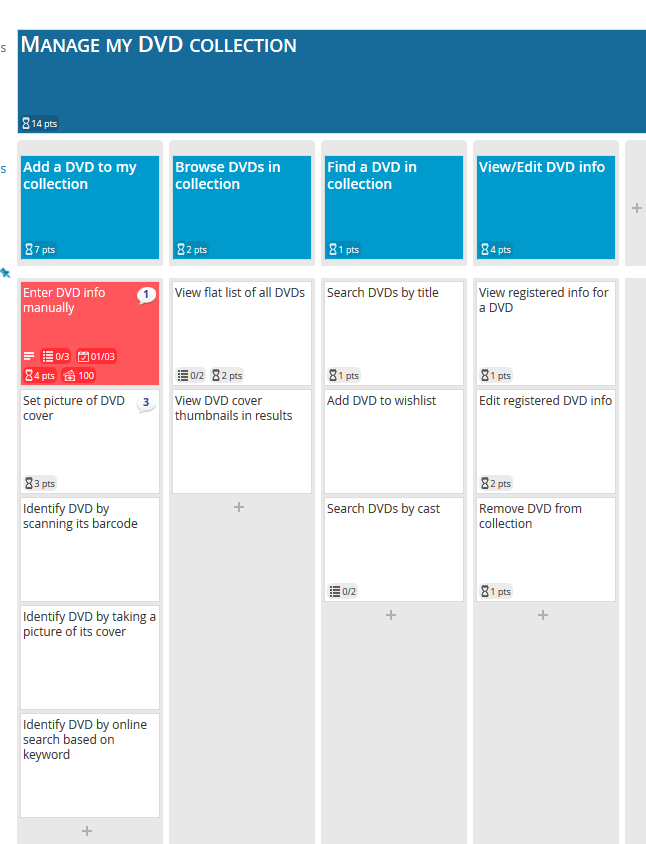
Here below you can see the Map with aggregation enabled for the horizontal layer, but not the vertical layer.

In the header to the left “Version 1” you can see the aggregated total for all values placed within the defined “Time”.

We want to add aggregation of values and costings in the Features and Activities layers.

MovieBuddy Map with Horizontal Aggregation

Let’s go through the steps to add aggregation for the verticals.

Enable Aggregation

It’s as easy as clicking the cards and choosing from the dropdown.

First lets take a look at the column “Manage favorite directors/actors”:

Here you can see the card contents below and at the bottom left a value of cost.

Mark/Unmark movie director as favorite is costed as $400

At a glance any user can look at the map and can very quickly get an idea of individual cards, but not the entire group.

Click the desired card or header (in this example we are clicking the card used as a header “Manage favorite directors/actors”

Select the custom options at the bottom right and select “enter a value” or “aggregate values”:

We enable aggregation under budget and will see the overall cost at a glance

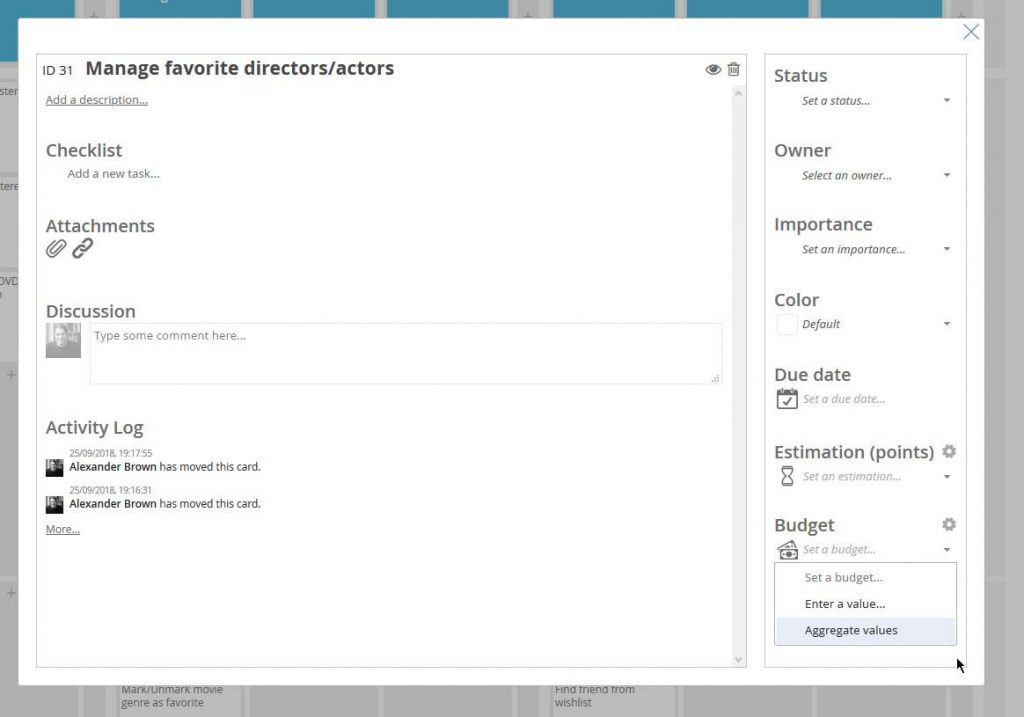
Once enabled, the header card will act as the parent and anything below that will aggregate.

This can work with cards, or even sub aggregations.

Now you can see the “Manage favorite directors/actors” displays $3500 automatically.

With aggregation you can see you entire maps costings, time or estimations aggregated as totals in your headers

This premium feature can work across any map, any cards and is entirely optional.

In addition you can rename the Budget and Estimation (points) to something appropriate and change the currency.

Enabling the aggregation for “points” in the vertical for all light blue layers and again in the dark blue layer:

With just a few clicks the map will now automatically aggregate all entered values.

Happy aggregating!

Basic Intro to Agile User Story Mapping

It can be tricky to see and prioritise hundreds of Jira entries, you need to know which of them are the highest valued features so that you can build them in an effective agile order. One easily adopted method is using Story Mapping and over a messy product backlog. Here I write how it is easier to create a quick User Story Map with the JIRA integration tool at FeatureMap.co

User Story Map is invented by Jeff Patton, he wrote a book (User Story Mapping) to explain about the concept and its practice, it is highly recommended to read the book to use story map more efficiently.

User Story Map
The Moviebuddy Current Version

Story mapping visualises the user’s journey in a step by step flow. These steps create a clear visual display of the requirements and help define your backlog. Compared to a flat backlog a user story map has added dimensions of position and movement through all verticals of your product. This allows you to first map and then navigate the entire user space of your product. With a user story map, you can then see you entire product, the full range of features and steps and gain a better understanding overall.

How a Story Map works

The StoryMap of Alex’s Morning

Groups: The broad actions that users take in order to reach their larger goals.

Lists: lower level under Groups, create the backbone of the map by telling the story or narrative of the user’s journey.

Stories: Basic building blocks of a map which describe something you can delivery and evaluate. Each block can be viewed for deeper detail.

Layers: Horizontal layers which split the story map to show what is in and out of each release.

Benefits of using Story Map

Here are few benefits of using story map as a user story tool:

  • Manage backlog with an overview and leveled structure
  • Brainstorm, discuss and prioritize user needs in a collaborative approach
  • Manage activities and tasks, and divide them into epics or user stories systematically
  • Arrangement and prioritization of user activities and user tasks, or drill down to refine them into related epics or user stories
  • Manage user stories in the online for both remote and co-location environments collaboratively for keeping everyone in your team the same page.