User Story Mapping boasts quick visual understanding at a glance. See cards, layers, groups, headers and quickly determine the map state.
FeatureMap can utilise coloured cards, multiple layers, importance settings and assignment to users.
One of the FeatureMap premium features is the aggregation of values.
Moviebuddy is our go to demo map and let’s jump straight into it.
Here below you can see the Map with aggregation enabled for the horizontal layer, but not the vertical layer.
In the header to the left “Version 1” you can see the aggregated total for all values placed within the defined “Time”.
We want to add aggregation of values and costings in the Features and Activities layers.
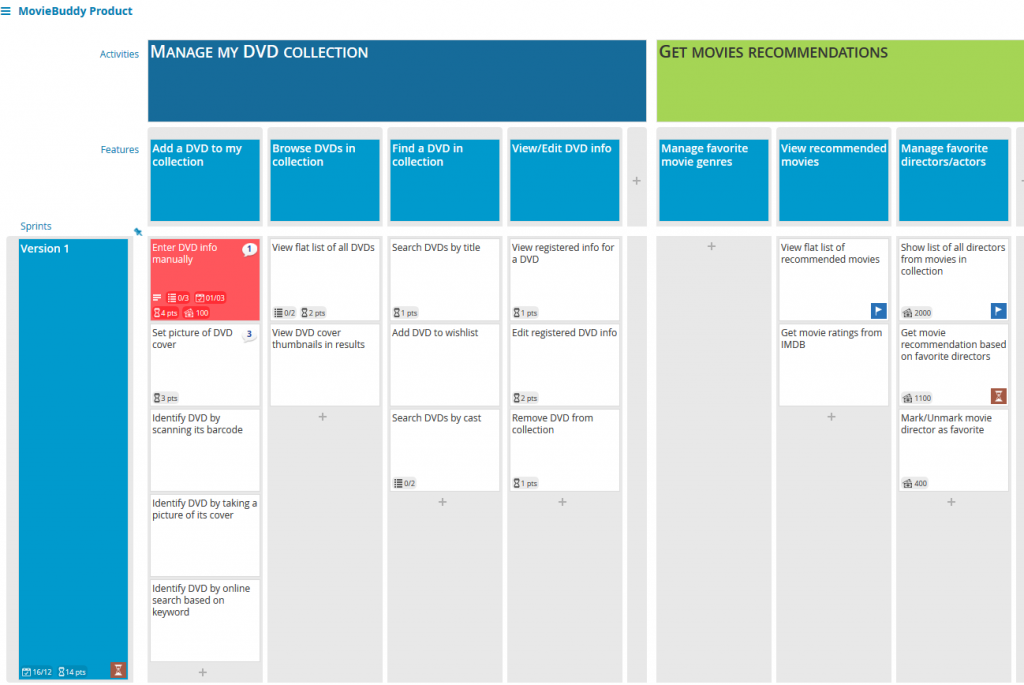
Let’s go through the steps to add aggregation for the verticals.
Enable Aggregation
It’s as easy as clicking the cards and choosing from the dropdown.
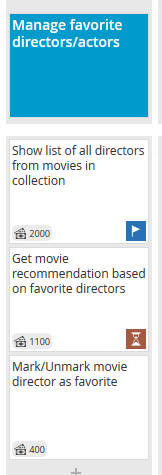
First lets take a look at the column “Manage favorite directors/actors”:
Here you can see the card contents below and at the bottom left a value of cost.
Mark/Unmark movie director as favorite is costed as $400
At a glance any user can look at the map and can very quickly get an idea of individual cards, but not the entire group.
Click the desired card or header (in this example we are clicking the card used as a header “Manage favorite directors/actors”
Select the custom options at the bottom right and select “enter a value” or “aggregate values”:
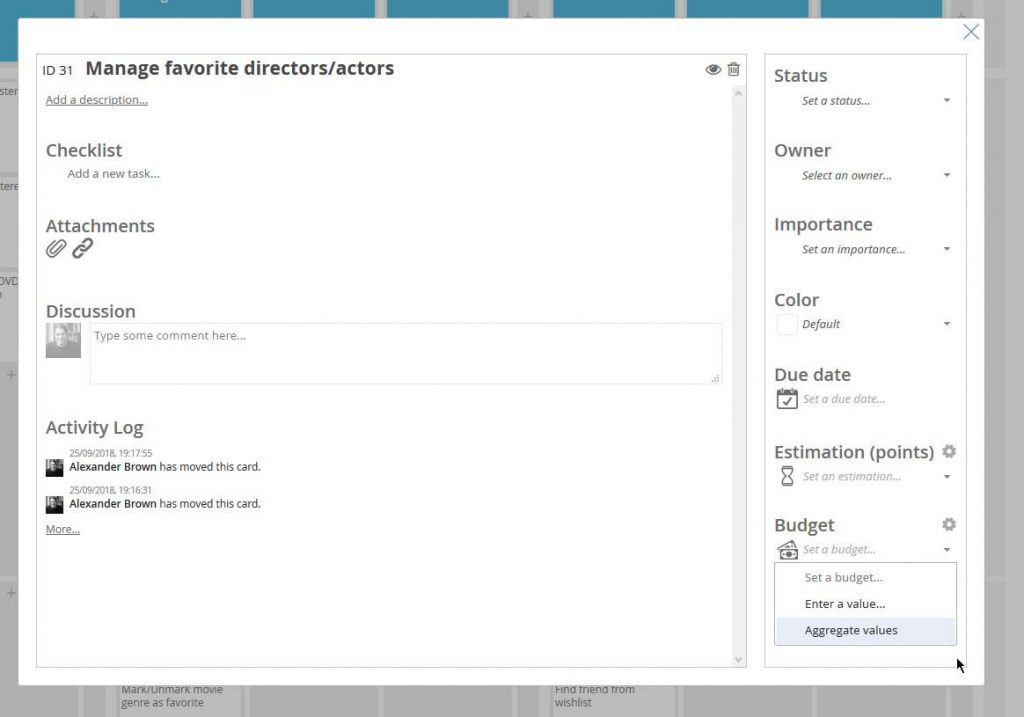
Once enabled, the header card will act as the parent and anything below that will aggregate.
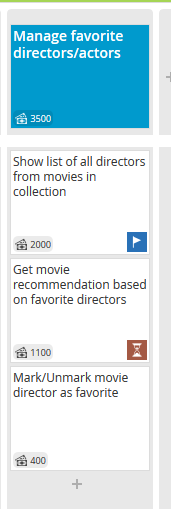
This can work with cards, or even sub aggregations.
Now you can see the “Manage favorite directors/actors” displays $3500 automatically.
With aggregation you can see you entire maps costings, time or estimations aggregated as totals in your headers
This premium feature can work across any map, any cards and is entirely optional.
In addition you can rename the Budget and Estimation (points) to something appropriate and change the currency.
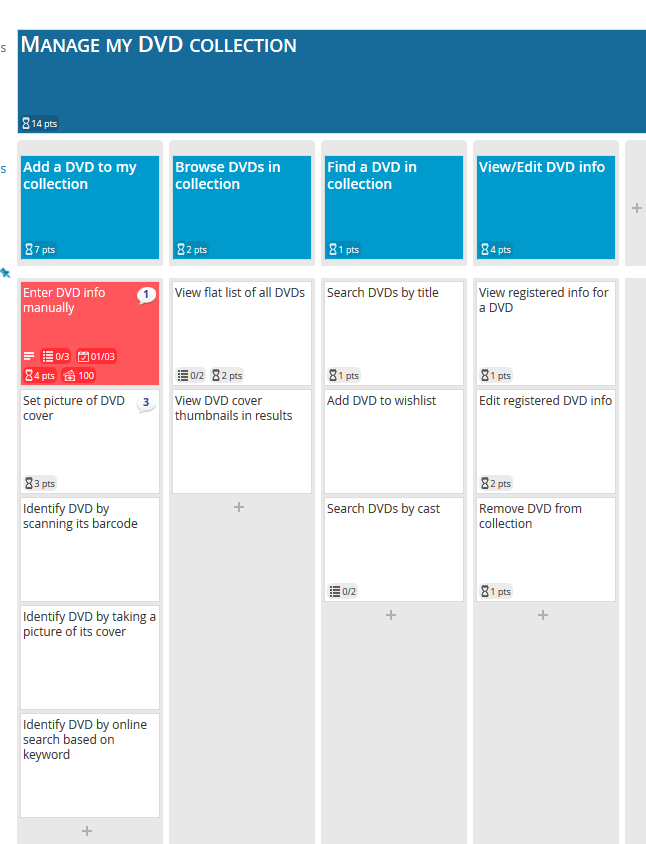
Enabling the aggregation for “points” in the vertical for all light blue layers and again in the dark blue layer:
Happy aggregating!
